
Stabilis Solutions Announces Fourth Quarter and Full Year 2024 Results
 Kazakhstan President Links Sovereign Wealth Fund Chief's Arrest to Anti-Corruption Drive

 Ella Stiller on 'Cupertino' and Her Stance on AI

 North Dakota Enacts Bipartisan Insulin Price Cap Amid National Push

 Basil Tuma Scores First Senior Goal as Malta Draws with Ten-Man Eswatini

 Rock & Roll Hall of Fame Inductees Announced; Attendance List Shrinks

 Trustpoint Xposure Launches Program to Help Startup Founders Check How AI Search Platforms Describe Their Companies

 Vulcan Minerals Inc. - Review and Update on Affiliated Company Atlas Salt Inc.

 Road Access Completed Drill Program to Begin

 Greenwich LifeSciences Interview to Air Nationally on the RedChip Small Stocks, Big Money(TM) Show on CNBC and Bloomberg TV
 Xenetic Biosciences Reports Third Quarter 2026 Financial Results and Highlights Strategic Business Updates

 GameSquare's Hatchet Publishes TikTok Live for Gaming in H1 2026 Report

 Digi Power X Reports Q3 2026 Revenue Up 85% and AI Revenue Up Over 400% Compared to Q2

 eXoZymes to Host Third Quarter 2026 update Conference Call on Thursday, November 19, 2026

 How Families Plan and Save for Holiday Travel

 Phoenix ABA Therapy Provider Action Behavior Centers Delivers Largest Donation in Jose's Closet History During Second Arizona Hands In Week
 U.S. Export-Import Bank Features NioCorp's Elk Creek Critical Minerals Project in EXIM's Factory Floor Fridays Initiative

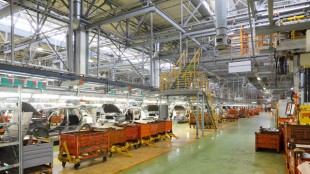 A Domestic Lithium Frontier: ELEKTROS Advances Review of Northern New York Opportunity

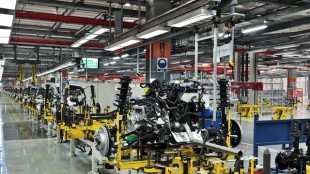 Positioning For America's Lithium Future: ELEKTROS Evaluates Northern New York Opportunity
 Sparta Capital Ltd. Announces Application to the Ontario Securities Commission to Become a Reporting Issuer in Ontario
 Rifstone Capital LLC Advances Institutional Research Platform with Expanded Global Allocation Framework

 Sekur Private Data Raises SekurOne Price 25% to US$3,750 Per Year
 Jane Maciver Joins Fragrance Creators Board

 Below Deck alumnus João Franco and brother arrested after fatal Turkey fight

 Thousands of Urban Homes Left Without High-Speed Internet Due to Broadband Blackspots

 Bunnie XO artwork taken down from Jelly Roll’s Nashville bar

HOUSTON, TEXAS / ACCESS Newswire / February 25, 2025 / Stabilis Solutions, Inc., ("Stabilis" or the "Company") (NASDAQ:SLNG), a leading provider of clean fueling, production, storage, and last mile delivery solutions for many of the world's most recognized, high-performance brands, today announced financial results for the fourth quarter and full year ended December 31, 2024.
FOURTH QUARTER 2024 HIGHLIGHTS
Net income of $2.1 million
Adjusted EBITDA of $4.0 million
Adjusted EBITDA margin of 23.2%
Cash flow from operations of $2.2 million
$9.0 million of cash and $4.3 million of availability under credit agreements as of December 31, 2024
FULL-YEAR 2024 HIGHLIGHTS
Net income of $4.6 million
Adjusted EBITDA of $11.8 million
Adjusted EBITDA margin of 16.1%
Cash flow from operations of $13.7 million
MANAGEMENT COMMENTARY
"Our fourth-quarter results marked the culmination of a strong year for Stabilis, a performance highlighted by year-over-year margin expansion, increased cash generation, and improved profitability," stated Casey Crenshaw, Executive Chairman and Interim President & Chief Executive Officer. ""Over the past year, we prioritized asset optimization and system efficiency, strengthening our position to accelerate growth with incremental contracts and customers."
"At a strategic level, we've continued to expand our small-scale LNG solutions platform to support both legacy and growth markets," continued Crenshaw. "In 2024, more than 80% of our capital expenditures were directed toward growth investments designed to further enhance our manufacturing and logistics capabilities as we ramp to support further commercial expansion in the years ahead. As always, we continue to foster a culture of safety, reliability, and performance excellence across the organization."
"Operating cash flow more than doubled on a year-over-year basis in 2024, driven by improved utilization of our Texas LNG liquefaction facility, and revenue growth within our aerospace and marine markets," stated Andy Puhala, Chief Financial Officer. "At year-end, we had $13.3 million in cash and availability under our credit agreements and remain well capitalized to support the business entering 2025 and we are actively engaged with potential debt and project financing partners for strategic, growth capital needs."
"Stabilis is in the early innings of an exciting, multi-year value creation journey," concluded Crenshaw. "Looking ahead, we intend to build upon over a decade of LNG experience and success as we capitalize on increased demand for LNG solutions across our diverse end markets."
STRATEGIC AND OPERATIONAL UPDATE
Strong competitive position within targeted, growth markets. Since the fourth quarter of last year, Stabilis' revenue mix in high-growth marine and aerospace end-markets increased from 14% of total revenue to nearly 50% in the fourth quarter of 2024. The Company is uniquely positioned as an incumbent small-scale LNG supplier of choice in these markets given its turn-key solutions offering, which includes production, storage, transportation, and fueling services.
Deploying capital toward growth-oriented investments. During 2024, the Company invested $7.4 million in growth capital, representing more than 80% of its total capital investment for the year. The Company's growth investments continue to focus on expanding capabilities, including in support of growth opportunities in both the Marine and Aerospace end-markets.
FOURTH QUARTER AND FULL YEAR 2024 CONFERENCE CALL AND WEBCAST
Stabilis will host a conference call on Wednesday February 26, 2025, at 9:00 am ET to review the Company's financial results, discuss recent events and conduct a question-and-answer session.
A webcast of the conference call will be available in the Investor Relations section of the Company's corporate website at https://investors.stabilis-solutions.com/events. To listen to a live broadcast, go to the site at least 15 minutes prior to the scheduled start time in order to register, download, and install any necessary audio software.
To participate in the live teleconference:
Domestic Live: 800-267-6316
International Live: 203-518-9783
Conference ID: SLNGQ424
To listen to a replay of the teleconference, which will be available through March 5, 2025:
Domestic Live: 800-839-0861
International Live: 402-220-0661
ABOUT STABILIS SOLUTIONS
Stabilis Solutions is a leading provider of clean fueling, production, storage, and last mile delivery solutions for many of the world's most recognized, high-performance brands. To learn more, visit www.stabilis-solutions.com.
CAUTIONARY STATEMENTS REGARDING FORWARD-LOOKING STATEMENTS
This press release includes "forward-looking statements" within the meaning of the safe harbor provisions of the U.S. Private Securities Litigation Reform Act of 1995 and within the meaning of Section 27a of the Securities Act of 1933, as amended, and Section 21e of the Securities Exchange Act of 1934, as amended. Any actual results may differ from expectations, estimates and projections presented or implied and, consequently, you should not rely on these forward-looking statements as predictions of future events. Words such as "can," "believes," "feels," "anticipates," "expects," "could," "will," "plan," "may," "should," "predicts," "potential" and similar expressions are intended to identify such forward-looking statements.
Such forward-looking statements relate to future events or future performance, but reflect our current beliefs, based on information currently available. Most of these factors are outside our control and are difficult to predict. A number of factors could cause actual events, performance or results to differ materially from the events, performance and results discussed in the forward-looking statements. Factors that may cause such differences include, among other things: the future performance of Stabilis, future demand for and price of LNG, availability and price of natural gas, unexpected costs, and general economic conditions.
The foregoing list of factors is not exclusive. Additional information concerning these and other risk factors is contained in the Risk Factors in Item 1A of our Annual Report on Form 10-K filed with the Securities and Exchange Commission on February 25, 2025 which is available on the SEC's website at www.sec.gov or on the Investors section of our website at www.stabilis-solutions.com. All subsequent written and oral forward-looking statements concerning Stabilis, or other matters attributable to Stabilis, or any person acting on its behalf are expressly qualified in their entirety by the cautionary statements above. Readers are cautioned not to place undue reliance upon any forward-looking statements, which speak only as of the date made. Stabilis does not undertake or accept any obligation or undertaking to release publicly any updates or revisions to any forward-looking statement to reflect any change in their expectations or any change in events, conditions or circumstances on which any such statement is based, except as required by law.
Stabilis Solutions, Inc. and Subsidiaries
Selected Consolidated Operating Results
(Unaudited, in thousands, except per share data)
Three Months Ended | Twelve Months Ended | ||||||||||||||
December 31, | September 30, | December 31, | December 31, | December 31, | |||||||||||
2024 | 2024 | 2023 | 2024 | 2023 | |||||||||||
Revenues: | |||||||||||||||
Revenues | $ | 17,298 | $ | 17,627 | $ | 18,049 | $ | 73,293 | $ | 73,114 | |||||
Operating expenses: | |||||||||||||||
Costs of revenues | 12,367 | 12,638 | 12,008 | 52,069 | 54,919 | ||||||||||
Change in unrealized loss (gain) on natural gas derivatives | 11 | 13 | (219 | ) | (310 | ) | (541 | ) | |||||||
Selling, general and administrative expenses | 1,941 | 3,035 | 3,469 | 11,763 | 12,893 | ||||||||||
Gain from disposal of fixed assets | (460 | ) | (102 | ) | (221 | ) | (761 | ) | (1,223 | ) | |||||
Depreciation expense | 1,802 | 1,776 | 1,872 | 7,146 | 7,878 | ||||||||||
Total operating expenses | 15,661 | 17,360 | 16,909 | 69,907 | 73,926 | ||||||||||
Income (loss) from operations before equity income | 1,637 | 267 | 1,140 | 3,386 | (812 | ) | |||||||||
Net equity income from foreign joint venture operations: | |||||||||||||||
Net equity income from foreign joint venture operations | 556 | 516 | 377 | 1,564 | 1,691 | ||||||||||
Income from operations | 2,193 | 783 | 1,517 | 4,950 | 879 | ||||||||||
Other income (expense): | |||||||||||||||
Interest income (expense), net | 7 | 81 | (19 | ) | 112 | (256 | ) | ||||||||
Interest expense, net - related parties | - | - | (7 | ) | - | (78 | ) | ||||||||
Other income (expense) | 7 | 10 | (49 | ) | 22 | (176 | ) | ||||||||
Total other income (expense) | 14 | 91 | (75 | ) | 134 | (510 | ) | ||||||||
Net income before income tax expense | 2,207 | 874 | 1,442 | 5,084 | 369 | ||||||||||
Income tax expense (benefit) | 101 | (123 | ) | 20 | 485 | 244 | |||||||||
Net income | 2,106 | 997 | 1,422 | 4,599 | 125 | ||||||||||
Net income per common share: | |||||||||||||||
Basic and diluted per common share | $ | 0.11 | $ | 0.05 | $ | 0.08 | $ | 0.25 | $ | 0.01 | |||||
EBITDA | $ | 4,002 | $ | 2,569 | $ | 3,340 | $ | 12,118 | $ | 8,581 | |||||
Adjusted EBITDA | $ | 4,013 | $ | 2,582 | $ | 2,900 | $ | 11,808 | $ | 6,817 | |||||
Stabilis Solutions, Inc. and Subsidiaries
Consolidated Balance Sheets
(Unaudited, in thousands, except share and per share data)
December 31, | ||||||
2024 | 2023 | |||||
Assets | ||||||
Current assets: | ||||||
Cash and cash equivalents | $ | 8,987 | $ | 5,374 | ||
Accounts receivable, net | 6,239 | 7,752 | ||||
Inventories, net | 345 | 169 | ||||
Prepaid expenses and other current assets | 1,902 | 1,677 | ||||
Total current assets | 17,473 | 14,972 | ||||
Property, plant and equipment: | ||||||
Cost | 117,246 | 110,646 | ||||
Less accumulated depreciation | (65,518 | ) | (61,167 | ) | ||
Property, plant and equipment, net | 51,728 | 49,479 | ||||
Goodwill | 4,314 | 4,314 | ||||
Investments in foreign joint ventures | 11,659 | 12,009 | ||||
Right-of-use assets and other noncurrent assets | 410 | 525 | ||||
Total assets | $ | 85,584 | $ | 81,299 | ||
Liabilities and Stockholders' Equity | ||||||
Current liabilities: | ||||||
Accounts payable | $ | 5,667 | $ | 5,707 | ||
Accrued liabilities | 3,566 | 4,166 | ||||
Current portion of long-term notes payable | 2,010 | 1,682 | ||||
Current portion of finance and operating lease obligations | 384 | 164 | ||||
Total current liabilities | 11,627 | 11,719 | ||||
Long-term notes payable, net of current portion and debt issuance costs | 6,848 | 7,747 | ||||
Long-term portion of operating lease obligations | 101 | 21 | ||||
Total liabilities | 18,576 | 19,487 | ||||
Commitments and contingencies | ||||||
Stockholders' Equity: | ||||||
Common stock; $0.001 par value, 37,500,000 shares authorized, 18,585,014 and 18,573,391 shares issued and outstanding at December 31, 2024 and December 31, 2023, respectively | 19 | 19 | ||||
Additional paid-in capital | 103,214 | 102,057 | ||||
Accumulated other comprehensive loss | (578 | ) | (18 | ) | ||
Accumulated deficit | (35,647 | ) | (40,246 | ) | ||
Total stockholders' equity | 67,008 | 61,812 | ||||
Total liabilities and stockholders' equity | $ | 85,584 | $ | 81,299 | ||
Stabilis Solutions, Inc. and Subsidiaries
Consolidated Statements of Cash Flows
(Unaudited, in thousands)
Three Months Ended | Twelves Months Ended | |||||||||||||||
December 31, | September 30, | December 31, | December 31, | December 31, | ||||||||||||
2024 | 2024 | 2023 | 2024 | 2023 | ||||||||||||
Cash flows from operating activities: | ||||||||||||||||
Net income | $ | 2,106 | $ | 997 | $ | 1,422 | $ | 4,599 | $ | 125 | ||||||
Adjustments to reconcile net income to net cash provided by operating activities: | ||||||||||||||||
Depreciation | 1,802 | 1,776 | 1,872 | 7,146 | 7,878 | |||||||||||
Stock-based compensation expense | 82 | 293 | 387 | 1,166 | 2,082 | |||||||||||
Bad debt expense | 14 | 20 | - | 102 | - | |||||||||||
Gain on disposal of assets | (460 | ) | (102 | ) | (221 | ) | (761 | ) | (1,223 | ) | ||||||
Income from equity investment in joint venture | (608 | ) | (575 | ) | (431 | ) | (1,770 | ) | (1,897 | ) | ||||||
Distributions from equity investment in joint venture | - | - | 412 | 1,716 | 1,225 | |||||||||||
Cash settlements from natural gas derivatives, net | - | - | - | (359 | ) | - | ||||||||||
Realized and unrealized (gains) losses from natural gas derivatives, net | 29 | 93 | 32 | 152 | 572 | |||||||||||
Changes in operating assets and liabilities: | ||||||||||||||||
Accounts receivable | (455 | ) | 109 | (1,617 | ) | 1,390 | 4,019 | |||||||||
Prepaid expenses and other current assets | 12 | 177 | 513 | 820 | 1,461 | |||||||||||
Accounts payable and accrued liabilities | (523 | ) | (22 | ) | (1,084 | ) | (678 | ) | (7,717 | ) | ||||||
Other | 172 | (211 | ) | 47 | 170 | 187 | ||||||||||
Net cash provided by operating activities | 2,171 | 2,555 | 1,332 | 13,693 | 6,712 | |||||||||||
Cash flows from investing activities: | ||||||||||||||||
Acquisition of fixed assets | (5,585 | ) | (1,312 | ) | (1,270 | ) | (9,146 | ) | (10,252 | ) | ||||||
Proceeds from sale of fixed assets | 460 | 102 | 1,255 | 841 | 1,255 | |||||||||||
Proceeds from notes receivable, related to prior sale of Brazil | 185 | - | 87 | 185 | 87 | |||||||||||
Net cash provided by (used in) investing activities | (4,940 | ) | (1,210 | ) | 72 | (8,120 | ) | (8,910 | ) | |||||||
Cash flows from financing activities: | ||||||||||||||||
Payments on short- and long-term notes payable | (625 | ) | (405 | ) | (319 | ) | (1,905 | ) | (1,179 | ) | ||||||
Payments on notes payable from related parties | - | - | (622 | ) | - | (2,435 | ) | |||||||||
Payment of debt issuance costs | - | - | - | - | (108 | ) | ||||||||||
Employee tax payments from restricted stock withholdings | - | - | - | (9 | ) | (162 | ) | |||||||||
Net cash used in financing activities | (625 | ) | (405 | ) | (941 | ) | (1,914 | ) | (3,884 | ) | ||||||
Effect of exchange rate changes on cash | (12 | ) | (30 | ) | (3 | ) | (46 | ) | 5 | |||||||
Net increase (decrease) in cash and cash equivalents | (3,406 | ) | 910 | 460 | 3,613 | (6,077 | ) | |||||||||
Cash and cash equivalents, beginning of period | 12,393 | 11,483 | 4,914 | 5,374 | 11,451 | |||||||||||
Cash and cash equivalents, end of period | $ | 8,987 | $ | 12,393 | $ | 5,374 | $ | 8,987 | $ | 5,374 | ||||||
Non-GAAP Measures
Our management uses EBITDA and Adjusted EBITDA to assess the performance and operating results of our business. EBITDA is defined as Earnings from continuing operations before Interest (includes interest income and interest expense), Taxes, Depreciation and Amortization. Adjusted EBITDA is defined as EBITDA further adjusted for certain special items that occur during the reporting period, as noted below. We include EBITDA and adjusted EBITDA to provide investors with a supplemental measure of our operating performance. Neither EBITDA nor Adjusted EBITDA is a recognized term under generally accepted accounting principles in the United States of America ("GAAP"). Accordingly, they should not be used as an indicator of, or an alternative to, net income as a measure of operating performance. In addition, EBITDA and Adjusted EBITDA are not intended to be measures of free cash flow available for management's discretionary use, as they do not consider certain cash requirements, such as debt service requirements. Because the definition of EBITDA and Adjusted EBITDA may vary among companies and industries, it may not be comparable to other similarly titled measures used by other companies. The following table provides a reconciliation of net income, the most directly comparable GAAP measure, to EBITDA and Adjusted EBITDA (in thousands).
Three Months Ended | Twelve Months Ended | |||||||||||||||
December 31, | September 30, | December 31, | December 31, | December 31, | ||||||||||||
2024 | 2024 | 2023 | 2024 | 2023 | ||||||||||||
Net income | $ | 2,106 | $ | 997 | $ | 1,422 | $ | 4,599 | $ | 125 | ||||||
Depreciation | 1,802 | 1,776 | 1,872 | 7,146 | 7,878 | |||||||||||
Interest expense, net | (7 | ) | (81 | ) | 26 | (112 | ) | 334 | ||||||||
Income tax expense | 101 | (123 | ) | 20 | 485 | 244 | ||||||||||
EBITDA | 4,002 | 2,569 | 3,340 | 12,118 | 8,581 | |||||||||||
Special items* | 11 | 13 | (440 | ) | (310 | ) | (1,764 | ) | ||||||||
Adjusted EBITDA | $ | 4,013 | $ | 2,582 | $ | 2,900 | $ | 11,808 | $ | 6,817 | ||||||
* | Special items for all periods presented consist of adjustments related to unrealized (gain)/loss on natural gas derivatives. The three months and year ended December 31, 2023 also include a subtraction of $0.2 million and $1.2 million, respectively for gains recognized on proceeds received related to property insurance claims. |
# # # # #
Investor Contact:
Andrew Puhala
Chief Financial Officer
832-456-6502
[email protected]
SOURCE: Stabilis Solutions
View the original press release on ACCESS Newswire
B.Finley--AMWN