
Pampa Energía Announces Fiscal Year and Fourth Quarter 2024 Results
 Kazakhstan President Links Sovereign Wealth Fund Chief's Arrest to Anti-Corruption Drive

 Ella Stiller on 'Cupertino' and Her Stance on AI

 North Dakota Enacts Bipartisan Insulin Price Cap Amid National Push
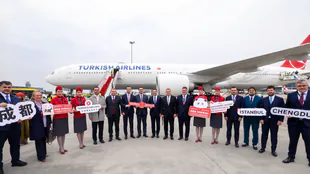
 Basil Tuma Scores First Senior Goal as Malta Draws with Ten-Man Eswatini

 Rock & Roll Hall of Fame Inductees Announced; Attendance List Shrinks

 Trustpoint Xposure Launches Program to Help Startup Founders Check How AI Search Platforms Describe Their Companies

 Vulcan Minerals Inc. - Review and Update on Affiliated Company Atlas Salt Inc.

 Road Access Completed Drill Program to Begin

 Greenwich LifeSciences Interview to Air Nationally on the RedChip Small Stocks, Big Money(TM) Show on CNBC and Bloomberg TV
 Xenetic Biosciences Reports Third Quarter 2026 Financial Results and Highlights Strategic Business Updates

 GameSquare's Hatchet Publishes TikTok Live for Gaming in H1 2026 Report

 Digi Power X Reports Q3 2026 Revenue Up 85% and AI Revenue Up Over 400% Compared to Q2

 eXoZymes to Host Third Quarter 2026 update Conference Call on Thursday, November 19, 2026

 How Families Plan and Save for Holiday Travel

 Phoenix ABA Therapy Provider Action Behavior Centers Delivers Largest Donation in Jose's Closet History During Second Arizona Hands In Week
 U.S. Export-Import Bank Features NioCorp's Elk Creek Critical Minerals Project in EXIM's Factory Floor Fridays Initiative

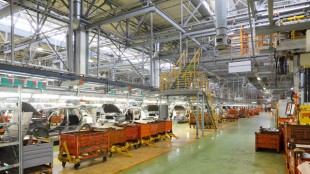 A Domestic Lithium Frontier: ELEKTROS Advances Review of Northern New York Opportunity
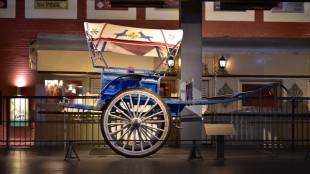
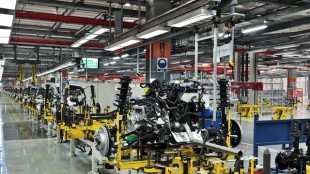 Positioning For America's Lithium Future: ELEKTROS Evaluates Northern New York Opportunity
 Sparta Capital Ltd. Announces Application to the Ontario Securities Commission to Become a Reporting Issuer in Ontario
 Rifstone Capital LLC Advances Institutional Research Platform with Expanded Global Allocation Framework

 Sekur Private Data Raises SekurOne Price 25% to US$3,750 Per Year
 Jane Maciver Joins Fragrance Creators Board

 Below Deck alumnus João Franco and brother arrested after fatal Turkey fight

 Thousands of Urban Homes Left Without High-Speed Internet Due to Broadband Blackspots

 Bunnie XO artwork taken down from Jelly Roll’s Nashville bar

BUENOS AIRES, AR / ACCESS Newswire / March 5, 2025 / Pampa Energía S.A. (NYSE:PAM)(Buenos Aires Stock Exchange:PAMP), an independent company with active participation in the Argentine electricity and gas value chain, announces the results for the fiscal year and quarter ended on December 31, 2024.
Pampa's financial information adopts US$ as functional currency, converted into AR$ at transactional exchange rate ('FX'). However, Transener and TGS's adjust their figures for inflation as of December 31, 2024, which are expressed in US$ at the period's closing FX. The previously reported figures remain unchanged.
Fourth quarter 2024 ('Q4 24') main results[1]
20% year-on-year sales increase, reaching US$435 million in Q4 24[2], driven by higher gas demand for power generation and crude oil volumes sold, as well as improved operating performance at Power Purchase Agreements ('PPA') units, Parque Eólico Pampa Energía 6 ('PEPE 6') and the reformer. These effects were partially offset by lower gas sales to industries and Chile, and petchem prices.
During Q4 24, gas production and thermal availability stood out:
Pampa's main operational KPIs | Q4 24 | Q4 23 | Variation | |
Oil and gas | Production (k boe/day) | 61.6 | 56.4 | +9% |
Gas over total production | 94% | 92% | +2% | |
Average gas price (US$/MBTU) | 2.9 | 3.2 | -10% | |
Average oil price (US$/bbl) | 67.6 | 68.9 | -2% | |
Power | Generation (GWh) | 4,797 | 5,017 | -4% |
Gross margin (US$/MWh) | 22.8 | 21.0 | +9% | |
Petrochemicals | Volume sold (k ton) | 121 | 94 | +29% |
Average price (US$/ton) | 1,017 | 1,264 | -20% | |
Adjusted EBITDA[3] was US$182 million in Q4 24, up 60% from Q4 23, mainly explained by tariff increases and AR$ real appreciation in Transportadora de Gas del Sur ('TGS') and Transener, higher deliveries under Plan Gas and the contributions from PEPE 6 and PPAs, offset by higher operating and development costs, along with lower gains from export settlements at a differential FX.
US$106 million profit to the Company's shareholders vs. a US$155 million loss in Q4 23 due to lower non-cash deferred income tax and higher sales and equity income from affiliates, offset by increased operating costs and lower gains from holding financial securities.
Net debt continued to decline, closing at US$410 million, the lowest amount and ratio since 2016, explained by the strong operating cash flows from core businesses and improved days sales outstanding.
Consolidated balance sheet
(As of December 31, 2024 and 2023, in millions)
As of 12.31.2024 | As of 12.31.2023 | ||||||||||
Figures in million | AR$ | US$ | AR$ | US$ | |||||||
ASSETS | |||||||||||
Property, plant and equipment | 2,690,533 | 2,607 | 2,056,974 | 2,544 | |||||||
Intangible assets | 99,170 | 95 | 77,898 | 96 | |||||||
Right-of-use assets | 11,330 | 11 | 17,259 | 21 | |||||||
Deferred tax asset | 161,694 | 157 | 2 | 0 | |||||||
Investments in joint ventures and associates | 1,024,769 | 993 | 542,978 | 672 | |||||||
Financial assets at fair value through profit and loss | 28,127 | 27 | 28,040 | 35 | |||||||
Other assets | 366 | 0 | 349 | 0 | |||||||
Trade and other receivables | 76,798 | 75 | 14,524 | 18 | |||||||
Total non-current assets | 4,092,787 | 3,965 | 2,738,024 | 3,387 | |||||||
Inventories | 230,095 | 223 | 166,023 | 205 | |||||||
Financial assets at amortized cost | 82,628 | 80 | 84,749 | 105 | |||||||
Financial assets at fair value through profit and loss | 877,623 | 850 | 451,883 | 559 | |||||||
Derivative financial instruments | 979 | 1 | 250 | 0 | |||||||
Trade and other receivables | 503,529 | 488 | 238,294 | 295 | |||||||
Cash and cash equivalents | 761,231 | 738 | 137,973 | 171 | |||||||
Total current assets | 2,456,085 | 2,380 | 1,079,172 | 1,335 | |||||||
Total assets | 6,548,872 | 6,345 | 3,817,196 | 4,722 | |||||||
EQUITY | |||||||||||
Equity attributable to owners of the company | 3,391,127 | 3,286 | 1,943,736 | 2,404 | |||||||
Non-controlling interest | 9,167 | 9 | 6,960 | 9 | |||||||
Total equity | 3,400,294 | 3,295 | 1,950,696 | 2,413 | |||||||
LIABILITIES | |||||||||||
Provisions | 141,436 | 137 | 119,863 | 148 | |||||||
Income tax and presumed minimum income tax liabilities | 77,284 | 75 | 44,614 | 55 | |||||||
Deferred tax liabilities | 50,223 | 49 | 240,686 | 298 | |||||||
Defined benefit plans | 31,293 | 30 | 13,172 | 16 | |||||||
Borrowings | 1,416,917 | 1,373 | 989,182 | 1,224 | |||||||
Trade and other payables | 87,992 | 84 | 37,301 | 46 | |||||||
Total non-current liabilities | 1,805,145 | 1,748 | 1,444,818 | 1,787 | |||||||
Provisions | 10,725 | 10 | 4,649 | 6 | |||||||
Income tax liabilities | 265,008 | 257 | 14,026 | 17 | |||||||
Taxes payables | 30,989 | 30 | 11,427 | 14 | |||||||
Defined benefit plans | 7,077 | 7 | 2,695 | 3 | |||||||
Salaries and social security payable | 40,035 | 39 | 15,537 | 19 | |||||||
Derivative financial instruments | 2 | 0 | 191 | 0 | |||||||
Borrowings | 728,096 | 706 | 181,357 | 224 | |||||||
Trade and other payables | 261,501 | 253 | 191,800 | 237 | |||||||
Total current liabilities | 1,343,433 | 1,302 | 421,682 | 522 | |||||||
Total liabilities | 3,148,578 | 3,050 | 1,866,500 | 2,309 | |||||||
Total liabilities and equity | 6,548,872 | 6,345 | 3,817,196 | 4,722 | |||||||
Consolidated income statement
(For the fiscal year and quarters ended on December 31, 2024 and 2023, in millions)
Fiscal year | Fourth quarter | |||||||||||||||||||||||||||
Figures in million | 2024 | 2023 | 2024 | 2023 | ||||||||||||||||||||||||
AR$ | US$ | AR$ | US$ | AR$ | US$ | AR$ | US$ | |||||||||||||||||||||
Sales revenue | 1,732,901 | 1,876 | 513,727 | 1,732 | 438,407 | 435 | 166,770 | 362 | ||||||||||||||||||||
Domestic sales | 1,457,480 | 1,575 | 429,205 | 1,423 | 371,138 | 368 | 143,313 | 306 | ||||||||||||||||||||
Foreign market sales | 275,421 | 301 | 84,522 | 309 | 67,269 | 67 | 23,457 | 56 | ||||||||||||||||||||
Cost of sales | (1,181,132 | ) | (1,279 | ) | (320,124 | ) | (1,107 | ) | (349,413 | ) | (349 | ) | (110,171 | ) | (257 | ) | ||||||||||||
Gross profit | 551,769 | 597 | 193,603 | 625 | 88,994 | 86 | 56,599 | 105 | ||||||||||||||||||||
Selling expenses | (68,713 | ) | (74 | ) | (19,338 | ) | (66 | ) | (17,333 | ) | (17 | ) | (6,005 | ) | (15 | ) | ||||||||||||
Administrative expenses | (225,718 | ) | (239 | ) | (62,721 | ) | (185 | ) | (100,878 | ) | (100 | ) | (28,092 | ) | (52 | ) | ||||||||||||
Exploration expenses | (20,711 | ) | (21 | ) | (1,859 | ) | (7 | ) | (20,455 | ) | (21 | ) | (87 | ) | - | |||||||||||||
Other operating income | 161,789 | 175 | 57,141 | 177 | 59,073 | 59 | 25,514 | 62 | ||||||||||||||||||||
Other operating expenses | (80,822 | ) | (88 | ) | (29,374 | ) | (88 | ) | (16,856 | ) | (16 | ) | (11,295 | ) | (20 | ) | ||||||||||||
Impairment of financial assets | (48,932 | ) | (56 | ) | 283 | - | (20 | ) | - | 698 | 4 | |||||||||||||||||
Impairment on PPE, int. assets & inventories | (34,058 | ) | (34 | ) | (30,784 | ) | (39 | ) | (15,480 | ) | (15 | ) | (30,460 | ) | (38 | ) | ||||||||||||
Results for part. in joint businesses & associates | 145,570 | 146 | 4,541 | (2 | ) | 51,239 | 45 | (9,503 | ) | (44 | ) | |||||||||||||||||
Income from the sale of associates | 33,128 | 34 | 6,262 | 9 | 27,363 | 27 | 5,776 | 8 | ||||||||||||||||||||
Operating income | 413,302 | 440 | 117,754 | 424 | 55,647 | 48 | 3,145 | 10 | ||||||||||||||||||||
Financial income | 31,780 | 32 | 1,764 | 5 | 27,685 | 28 | 674 | 1 | ||||||||||||||||||||
Financial costs | (168,927 | ) | (185 | ) | (105,359 | ) | (364 | ) | (47,995 | ) | (48 | ) | (34,263 | ) | (81 | ) | ||||||||||||
Other financial results | 198,477 | 211 | 155,089 | 558 | 98,671 | 97 | 59,295 | 166 | ||||||||||||||||||||
Financial results, net | 61,330 | 58 | 51,494 | 199 | 78,361 | 77 | 25,706 | 86 | ||||||||||||||||||||
Profit before tax | 474,632 | 498 | 169,248 | 623 | 134,008 | 125 | 28,851 | 96 | ||||||||||||||||||||
Income tax | 90,158 | 121 | (132,557 | ) | (318 | ) | (21,557 | ) | (19 | ) | (112,120 | ) | (249 | ) | ||||||||||||||
Net income for the period | 564,790 | 619 | 36,691 | 305 | 112,451 | 106 | (83,269 | ) | (153 | ) | ||||||||||||||||||
Attributable to the owners of the Company | 564,587 | 619 | 34,488 | 302 | 111,957 | 106 | (85,220) | (155) | ||||||||||||||||||||
Attributable to the non-controlling interest | 203 | - | 2,203 | 3 | 494 | - | 1,951 | 2 | ||||||||||||||||||||
Net income per share to shareholders | 415.1 | 0.5 | 25.2 | 0.2 | 82.3 | 0.1 | (62.7 | ) | (0.1 | ) | ||||||||||||||||||
Net income per ADR to shareholders | 10,378.4 | 11.4 | 631.2 | 5.5 | 2,058.0 | 1.9 | (1,566.5 | ) | (2.9 | ) | ||||||||||||||||||
Average outstanding common shares1 | 1,360 | 1,366 | 1,360 | 1,360 | ||||||||||||||||||||||||
Outstanding shares by the end of period1 | 1,360 | 1,360 | 1,360 | 1,360 | ||||||||||||||||||||||||
Note: 1 It considers the Employee stock-based compensation plan shares, which amounted to 3.9 million common shares as of December 31, 2023 and 2024.
For the full version of the Earnings Report, please visit Pampa's Investor Relations website: ri.pampa.com/en.
Information about the videoconference
There will be a videoconference to discuss Pampa's Q4 24 results on Thursday, March 6, 2025, at 10:00 a.m. Eastern Standard Time/12:00 p.m. Buenos Aires Time. The hosts will be Gustavo Mariani, CEO, Adolfo Zuberbühler, CFO, Horacio Turri, VP and executive director of E&P and Lida Wang, investor relations and sustainability officer at Pampa.
For those interested in participating, please register here.
For further information about Pampa:
[1] The information is based on financial statements ('FS') prepared according to International Financial Reporting Standards ('IFRS') in force in Argentina.
[2] Sales from the affiliates CTBSA, Transener and TGS are excluded, shown as 'Results for participation in joint businesses and associates.'
[3] Consolidated adjusted EBITDA represents the flows before financial items, income tax, depreciations and amortizations, extraordinary and non-cash income and expense, equity income, and includes affiliates' EBITDA at our ownership. Further information on section 3.1.
SOURCE: 1/3 Pampa Energía S.A.
View the original press release on ACCESS Newswire
O.Johnson--AMWN