
Patterson-UTI Energy Reports Financial Results for the Quarter Ended March 31, 2026
 Cummins admits changes may be made after loss to South Africa

 Atletico beat Levante to move top above Barcelona

 Chelsea defeat pushes Carrick closer to Man Utd exit

 Pogacar 'happy to be alive' after difficult Vuelta crash recovery

 South Africa beat Australia by 176 runs in third Test to win series

 Evacuees from Russian-occupied Oleshky expected in Ukraine

 UK PM 'open' to slavery apology but not reparations

 Kimono-clad pets blessed at Japan festival lacking enough kids

 Hakimi bags hat-trick as PSG rip Le Havre to pieces

 In-form Fernandez sets up Tokyo final against Russia's Shnaider

 Scam centres relocated from Cambodia operate in Madagascar

 Marc Marquez on front row at Malaysian MotoGP as Martin ruled out

 Injured Martin out of Malaysian MotoGP in big title blow

 US, S.Korea, Japan vow 'complete' N.Korea denuclearization

 Nations commit to get nature goals back on track

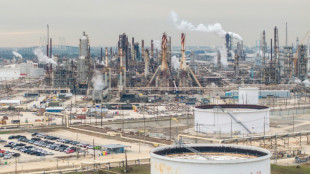 US oil companies aim to squeeze more out of refineries

 How to Repurpose Old Furniture into New Treasures

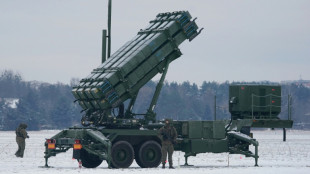 Trump admin approves potential Patriot missiles sale to Ukraine

 Sun Goddess wins at Breeders' Cup, O'Brien leads Baffert

 Nations agree push to get nature goals on track

 Leclerc shows practice pace as Antonelli prowls in Mexico

 Trump, Milei under pressure to explain Bolsonaro flight from Brazil

 Hakimi bags hat-trick as Paris Saint-Germain rip Le Havre to pieces

 Polish riot police deployed after court chief suspended

 Emery's focus fully on Fulham despite Barcelona tie

HOUSTON, TX / ACCESS Newswire / April 22, 2026 / PATTERSON-UTI ENERGY, INC. (NASDAQ:PTEN) today reported financial results for the quarter ended March 31, 2026.
First Quarter 2026 Financial Results and Other Key Items
First Quarter 2026 Total Revenue of $1.1 billion
First Quarter 2026 Net Loss Attributable to Common Stockholders of $25 million
First Quarter 2026 Adjusted EBITDA(1) of $205 million
Declared a quarterly dividend of $0.10 per share, payable on June 15, 2026 to holders of record as of June 1, 2026
Management Commentary
"We delivered another quarter of solid operating results, as our businesses successfully navigated a challenging commodity environment to start the year," said Andy Hendricks, Chief Executive Officer. "We are pleased with our performance given the macro backdrop earlier this year, with customers operating under budgets that were built around much lower oil price assumptions than what we see today. We continue to prioritize equipment and technology investments that improve demand for our drilling and completion businesses and help manage costs. We expect the benefits of these investments to build over time, particularly as U.S. land drilling and completion activity improves."
"Looking ahead, geopolitical events have significantly increased the commodity strip for the next several years, and we believe U.S. activity will need to go higher just to hold U.S. onshore oil production steady," continued Mr. Hendricks. "The second quarter represents a market inflection in response to improved commodity prices. As a result, in our Drilling Services segment we are activating drilling rigs later in the second quarter, and we anticipate reactivating additional rigs in the second half of 2026. In our Completion Services segment, we are close to full utilization across our active fleet, and we are discussing price increases with our customers to more appropriately reflect an increasing demand environment coupled with current high industry utilization."
"We continue to be excited about the strong free cash flow potential for our company this year," said Andy Smith, Chief Financial Officer. "Working capital headwinds in the first half of the year typically give way to tailwinds as the year progresses, and we expect this progression to be the same this year. As we continue to assess the outlook for the company under a new commodity price scenario, our corporate priorities remain unchanged; invest in equipment and digital technology that we believe will enhance our long-term sustainable operating advantage, generate strong and sustainable free cash flow, maintain a strong balance sheet, and return capital to our shareholders."
Drilling Services
First quarter Drilling Services segment revenue totaled $352 million, with adjusted gross profit(2) of $134 million. Our U.S. Contract Drilling operating days totaled 8,301, with an average of 92 rigs working in the quarter. Revenue and adjusted gross profit during the first quarter included approximately $3 million in early termination payments.
Pricing was relatively steady for our U.S. Contract Drilling business. Additionally, we saw a full quarter of benefit for cost reduction measures that were implemented towards the end of 2025.
Completion Services
First quarter Completion Services revenue totaled $680 million, with adjusted gross profit of $98 million.
First quarter activity in our Completion Services segment was impacted by roughly 5 days of disruption from winter storms across nearly our entire fleet. Aside from the associated downtime from the winter storms, utilization of our active equipment remained high, and equipment that can be powered by natural gas was near full utilization.
Drilling Products
First quarter Drilling Products revenue totaled $80 million, with adjusted gross profit of $33 million.
Results in our Drilling Products segment were solid despite some industry headwinds. The segment was impacted by geopolitical events in the Middle East, with the Middle East comprising roughly 10-15% of the segment revenue. Starting late in the quarter, in the Middle East we saw an increase in costs, including personnel and logistics costs, some disruption associated with getting products to location, and a reduction in offshore activity.
Other
First quarter Other revenue totaled $6 million, with adjusted gross profit of $3 million.
Outlook
For the second quarter in Drilling Services, we expect an average U.S. rig count of approximately 90 rigs. We anticipate exiting the quarter at a higher level than the quarterly average, as we reactivate rigs during the second half of the quarter-resulting in an exit rate near our highest activity level so far this year. We expect adjusted gross profit in the Drilling Services segment of approximately $130 million. This outlook includes approximately $5 million of rig reactivation costs, with minimal second-quarter revenue expected from those rigs.
In our Completion Services segment for the second quarter, we expect adjusted gross profit to be approximately $105 million, with continued high utilization of our active equipment. We will continue to prioritize investments that high-grade our assets with technologies that we believe will generate attractive long-term returns, versus investing to extend the life of diesel equipment.
In our Drilling Products segment for the second quarter, we expect adjusted gross profit will decline slightly compared to the first quarter. We expect lower activity in Canada with normal seasonal spring breakup, as well as an increase in international costs, particularly in the Middle East.
We expect Other adjusted gross profit in the second quarter to be approximately $5 million.
For the second quarter, we expect general and administrative expense to be approximately $67 million, and we expect depreciation, depletion, amortization, and impairment expense of approximately $220 million.
All references to "per share" in this press release are diluted earnings per common share as defined within Accounting Standards Codification Topic 260.
First Quarter Earnings Conference Call
The Company's quarterly conference call to discuss the operating results for the quarter ended March 31, 2026, is scheduled for April 23, 2026, at 9:00 a.m. Central Time. The dial-in information for participants is (800) 715-9871 (Domestic) and (646) 307-1963 (International). The conference ID for both numbers is 5526772. The call is also being webcast and can be accessed through the Investor Relations section of the Company's website at investor.patenergy.com. A replay of the conference call will be on the Company's website for two weeks.
About Patterson-UTI
Patterson-UTI is a leading provider of drilling and completion services to oil and natural gas exploration and production companies in the United States and other select countries, including contract drilling services, integrated well completion services and directional drilling services in the United States, and specialized bit solutions in the United States, Middle East and many other regions around the world. For more information, visit www.patenergy.com.
Cautionary Statement Regarding Forward-Looking Statements
This press release contains forward-looking statements which are protected as forward-looking statements under the Private Securities Litigation Reform Act of 1995 that are not limited to historical facts, but reflect Patterson-UTI's current beliefs, expectations or intentions regarding future events. Words such as "anticipate," "believe," "budgeted," "continue," "could," "estimate," "expect," "goal," "intend," "may," "plan," "potential," "predict," "project," "pursue," "see," "should," "strategy," "target," or "will," and similar expressions are intended to identify such forward-looking statements. The statements in this press release that are not historical statements, including, without limitation, statements regarding Patterson-UTI's future expectations, beliefs, plans, strategy, objectives, financial conditions, operations outlook, assumptions or future events or performance, activity levels, active rig count projections, contract terms, capex spending and budgets, future cash flow, future use of generated cash flow, customer demand, future commodity prices, outlook for international and domestic markets, and timing and amount of dividends, are forward-looking statements within the meaning of the federal securities laws. These statements are subject to numerous risks and uncertainties, many of which are beyond Patterson-UTI's control, which could cause actual results to differ materially from the results expressed or implied by the statements. For information regarding risks and uncertainties that could cause actual results to differ materially from those in the forward-looking statements, please refer to the "Risk Factors" and "Management's Discussion and Analysis of Financial Condition and Results of Operations" sections and other disclosures in Patterson-UTI's SEC filings, including but not limited to its Annual Report on Form 10‑K and Quarterly Reports on Form 10‑Q.
Additional information concerning risks and uncertainties associated with Patterson-UTI's business is contained from time to time in Patterson-UTI's SEC filings. Patterson-UTI's filings may be obtained by contacting Patterson-UTI or the SEC or through Patterson-UTI's website at http://www.patenergy.com or through the SEC's Electronic Data Gathering and Analysis Retrieval System (EDGAR) at http://www.sec.gov. Patterson-UTI undertakes no obligation to publicly update or revise any forward-looking statement.
Non-GAAP Financial Measures
(1) Adjusted earnings before interest, taxes, depreciation and amortization ("Adjusted EBITDA") is not defined by GAAP. See Non-GAAP Financial Measures below for a reconciliation of net income to Adjusted EBITDA.
(2) Adjusted gross profit is considered a non-GAAP financial measure. See Non-GAAP Financial Measures below for a reconciliation of GAAP gross profit to adjusted gross profit by segment.
PATTERSON-UTI ENERGY, INC.
Condensed Consolidated Balance Sheets
(unaudited, in thousands)
March 31, | December 31, | |||
ASSETS |
|
| ||
Current assets: |
|
| ||
Cash, cash equivalents and restricted cash | $ | 337,244 | $ | 420,642 |
Accounts receivable, net | 742,379 | 723,277 | ||
Inventory | 150,592 | 160,280 | ||
Other current assets | 92,057 | 113,892 | ||
Total current assets | 1,322,272 | 1,418,091 | ||
Property and equipment, net | 2,627,928 | 2,711,037 | ||
Goodwill | 487,388 | 487,388 | ||
Intangible assets, net | 784,217 | 814,810 | ||
Other assets | 138,714 | 139,140 | ||
Total assets | $ | 5,360,519 | $ | 5,570,466 |
LIABILITIES AND STOCKHOLDERS' EQUITY | ||||
Current liabilities: | ||||
Accounts payable | $ | 442,423 | $ | 470,782 |
Accrued liabilities | 256,326 | 366,488 | ||
Other current liabilities | 21,502 | 26,372 | ||
Total current liabilities | 720,251 | 863,642 | ||
Long-term debt, net | 1,221,363 | 1,221,038 | ||
Deferred tax liabilities, net | 212,032 | 215,818 | ||
Other liabilities | 41,170 | 45,253 | ||
Total liabilities | 2,194,816 | 2,345,751 | ||
Stockholders' equity: | ||||
Stockholders' equity attributable to controlling interests | 3,159,375 | 3,218,538 | ||
Noncontrolling interest | 6,328 | 6,177 | ||
Total equity | 3,165,703 | 3,224,715 | ||
Total liabilities and stockholders' equity | $ | 5,360,519 | $ | 5,570,466 |
PATTERSON-UTI ENERGY, INC.
Condensed Consolidated Statements of Operations
(unaudited, in thousands, except per share data)
Three Months Ended | ||||||||||
March 31, | December 31, | March 31, | ||||||||
2026 | 2025 | 2025 | ||||||||
REVENUES | $ | 1,117,331 | $ | 1,150,813 | $ | 1,280,537 | ||||
COSTS AND EXPENSES: | ||||||||||
Direct operating costs | 849,155 | 871,892 | 961,414 | |||||||
Depreciation, depletion, amortization and impairment | 218,394 | 220,942 | 231,866 | |||||||
General and administrative | 68,763 | 62,058 | 66,930 | |||||||
Other operating expense (income), net | (4,664 | ) | (3,844 | ) | 3,382 | |||||
Total operating costs and expenses | 1,131,648 | 1,151,048 | 1,263,592 | |||||||
OPERATING INCOME (LOSS) | (14,317 | ) | (235 | ) | 16,945 | |||||
OTHER INCOME (EXPENSE): | ||||||||||
Interest income | 2,765 | 2,433 | 1,464 | |||||||
Interest expense, net of amount capitalized | (17,485 | ) | (17,678 | ) | (17,697 | ) | ||||
Other income (expense) | 965 | 354 | 1,968 | |||||||
Total other income (expense) | (13,755 | ) | (14,891 | ) | (14,265 | ) | ||||
INCOME (LOSS) BEFORE INCOME TAXES | (28,072 | ) | (15,126 | ) | 2,680 | |||||
INCOME TAX EXPENSE (BENEFIT) | (3,596 | ) | (5,929 | ) | 1,390 | |||||
NET INCOME (LOSS) | (24,476 | ) | (9,197 | ) | 1,290 | |||||
NET INCOME (LOSS) ATTRIBUTABLE TO NONCONTROLLING INTEREST | 151 | (103 | ) | 285 | ||||||
NET INCOME (LOSS) ATTRIBUTABLE TO COMMON STOCKHOLDERS | $ | (24,627 | ) | $ | (9,094 | ) | $ | 1,005 | ||
NET INCOME (LOSS) ATTRIBUTABLE TO COMMON STOCKHOLDERS PER COMMON SHARE: | ||||||||||
Basic | $ | (0.06 | ) | $ | (0.02 | ) | $ | 0.00 | ||
Diluted | $ | (0.06 | ) | $ | (0.02 | ) | $ | 0.00 | ||
WEIGHTED AVERAGE NUMBER OF COMMON SHARES OUTSTANDING: | ||||||||||
Basic | 379,587 | 379,243 | 386,521 | |||||||
Diluted | 379,587 | 379,243 | 387,044 | |||||||
CASH DIVIDENDS PER COMMON SHARE | $ | 0.10 | $ | 0.08 | $ | 0.08 | ||||
PATTERSON-UTI ENERGY, INC.
Condensed Consolidated Statements of Cash Flows
(unaudited, in thousands)
Three Months Ended | ||||||
March 31, | ||||||
2026 | 2025 | |||||
Cash flows from operating activities: |
|
| ||||
Net income (loss) | $ | (24,476 | ) | $ | 1,290 | |
Adjustments to reconcile net income (loss) to net cash provided by operating activities: | ||||||
Depreciation, depletion, amortization and impairment | 218,394 | 231,866 | ||||
Deferred income tax expense (benefit) | (3,792 | ) | 359 | |||
Stock-based compensation | 4,412 | 12,289 | ||||
Net (gain) loss on asset disposals | 1,861 | (709 | ) | |||
Other | (1,600 | ) | (166 | ) | ||
Changes in operating assets and liabilities | (130,941 | ) | (36,788 | ) | ||
Net cash provided by operating activities | 63,858 | 208,141 | ||||
Cash flows from investing activities: | ||||||
Purchases of property and equipment | (116,628 | ) | (161,831 | ) | ||
Proceeds from disposal of assets, including insurance recoveries | 12,220 | 4,380 | ||||
Other | (1,618 | ) | (7,053 | ) | ||
Net cash used in investing activities | (106,026 | ) | (164,504 | ) | ||
Cash flows from financing activities: | ||||||
Purchases of treasury stock | (350 | ) | (20,295 | ) | ||
Dividends paid | (37,960 | ) | (30,877 | ) | ||
Payments of finance leases | (1,959 | ) | (2,632 | ) | ||
Other | - | (5,069 | ) | |||
Net cash used in financing activities | (40,269 | ) | (58,873 | ) | ||
Effect of foreign exchange rate changes on cash, cash equivalents and restricted cash | (961 | ) | (853 | ) | ||
Net change in cash, cash equivalents and restricted cash | (83,398 | ) | (16,089 | ) | ||
Cash, cash equivalents and restricted cash at beginning of period | 420,642 | 241,293 | ||||
Cash, cash equivalents and restricted cash at end of period | $ | 337,244 | $ | 225,204 | ||
PATTERSON-UTI ENERGY, INC.
Additional Financial and Operating Data
(unaudited, dollars in thousands)
Three Months Ended | ||||||||||
March 31, | December 31, | March 31, | ||||||||
2026 | 2025 | 2025 | ||||||||
Drilling Services |
|
|
| |||||||
Revenues | $ | 351,717 | $ | 360,777 | $ | 412,860 | ||||
Direct operating costs | $ | 217,861 | $ | 228,426 | $ | 247,629 | ||||
Adjusted gross profit (1) | $ | 133,856 | $ | 132,351 | $ | 165,231 | ||||
Depreciation, amortization and impairment | $ | 83,944 | $ | 85,044 | $ | 84,972 | ||||
General and administrative | $ | 7,097 | $ | 4,013 | $ | 3,945 | ||||
Other operating expense (income), net | $ | (1,488 | ) | $ | 298 | $ | - | |||
Operating income (loss) | $ | 44,303 | $ | 42,996 | $ | 76,314 | ||||
Operating days - U.S. (2) | 8,301 | 8,596 | 9,573 | |||||||
Capital expenditures | $ | 54,421 | $ | 61,194 | $ | 73,458 | ||||
Completion Services | ||||||||||
Revenues | $ | 679,587 | $ | 701,560 | $ | 766,080 | ||||
Direct operating costs | $ | 581,486 | $ | 590,657 | $ | 657,681 | ||||
Adjusted gross profit (1) | $ | 98,101 | $ | 110,903 | $ | 108,399 | ||||
Depreciation, amortization and impairment | $ | 111,472 | $ | 110,941 | $ | 115,826 | ||||
General and administrative | $ | 7,330 | $ | 9,863 | $ | 11,409 | ||||
Other operating expense (income), net | $ | - | $ | (6,300 | ) | $ | - | |||
Operating income (loss) | $ | (20,701 | ) | $ | (3,601 | ) | $ | (18,836 | ) | |
Capital expenditures | $ | 45,101 | $ | 59,069 | $ | 62,173 | ||||
Drilling Products | ||||||||||
Revenues | $ | 79,797 | $ | 83,774 | $ | 85,663 | ||||
Direct operating costs | $ | 46,924 | $ | 49,590 | $ | 46,940 | ||||
Adjusted gross profit (1) | $ | 32,873 | $ | 34,184 | $ | 38,723 | ||||
Depreciation, amortization and impairment | $ | 19,846 | $ | 20,515 | $ | 22,876 | ||||
General and administrative | $ | 7,923 | $ | 6,911 | $ | 9,119 | ||||
Operating income (loss) | $ | 5,104 | $ | 6,758 | $ | 6,728 | ||||
Capital expenditures | $ | 15,842 | $ | 14,616 | $ | 18,222 | ||||
Other (3) | ||||||||||
Revenues | $ | 6,230 | $ | 4,702 | $ | 15,934 | ||||
Direct operating costs | $ | 2,884 | $ | 3,219 | $ | 9,164 | ||||
Adjusted gross profit (1) | $ | 3,346 | $ | 1,483 | $ | 6,770 | ||||
Depreciation, depletion, amortization and impairment | $ | 1,269 | $ | 2,429 | $ | 6,336 | ||||
General and administrative | $ | 2 | $ | 1 | $ | 204 | ||||
Operating income (loss) | $ | 2,075 | $ | (947 | ) | $ | 230 | |||
Capital expenditures | $ | 1,111 | $ | 3,411 | $ | 3,596 | ||||
Corporate | ||||||||||
Depreciation | $ | 1,863 | $ | 2,013 | $ | 1,856 | ||||
General and administrative | $ | 46,411 | $ | 41,270 | $ | 42,253 | ||||
Other operating expense (income), net | $ | (3,176 | ) | $ | 2,158 | $ | 3,382 | |||
Capital expenditures | $ | 153 | $ | 223 | $ | 4,382 | ||||
Total Capital Expenditures | $ | 116,628 | $ | 138,513 | $ | 161,831 | ||||
Adjusted gross profit, which is considered a non-GAAP financial measure, is defined as revenues less direct operating costs (excluding depreciation, depletion, amortization and impairment expense). See Non-GAAP Financial Measures below for a reconciliation of GAAP gross profit to adjusted gross profit by segment.
Operational data relates to our contract drilling business. A rig is considered to be operating if it is earning revenue pursuant to a contract on a given day.
Other includes our oilfield rentals business, prior to its divestiture in April 2025, and oil and natural gas working interests.
PATTERSON-UTI ENERGY, INC.
Non-GAAP Financial Measures
Adjusted EBITDA Reconciliations
(unaudited, dollars in thousands)
The following table reconciles Net income (loss) per the information below to Adjusted earnings before interest, taxes, depreciation and amortization ("Adjusted EBITDA") as reported on the unaudited Condensed Consolidated Statements of Operations:
Three Months Ended | ||||||||||
March 31, | December 31, | March 31, | ||||||||
2026 | 2025 | 2025 | ||||||||
Net income (loss) | $ | (24,476 | ) | $ | (9,197 | ) | $ | 1,290 | ||
Income tax expense (benefit) | (3,596 | ) | (5,929 | ) | 1,390 | |||||
Net interest expense | 14,720 | 15,245 | 16,233 | |||||||
Depreciation, depletion, amortization and impairment | 218,394 | 220,942 | 231,866 | |||||||
Merger and integration expense | - | 6 | 432 | |||||||
Adjusted EBITDA(1) | $ | 205,042 | $ | 221,067 | $ | 251,211 | ||||
Total revenues | $ | 1,117,331 | $ | 1,150,813 | $ | 1,280,537 | ||||
Adjusted EBITDA by Operating Segment: | ||||||||||
Drilling Services | $ | 128,247 | $ | 128,040 | $ | 161,286 | ||||
Completion Services | 90,771 | 107,340 | 96,990 | |||||||
Drilling Products | 24,950 | 27,273 | 29,604 | |||||||
Other | 3,344 | 1,482 | 6,566 | |||||||
Corporate | (42,270 | ) | (43,068 | ) | (43,235 | ) | ||||
Adjusted EBITDA | $ | 205,042 | $ | 221,067 | $ | 251,211 | ||||
Adjusted EBITDA is not defined by accounting principles generally accepted in the United States of America ("GAAP"). We define Adjusted EBITDA as net income (loss) plus income tax expense (benefit), net interest expense, depreciation, depletion, amortization and impairment expense, legal accruals and settlements, impairment of goodwill and merger and integration expense. We present Adjusted EBITDA as a supplemental disclosure because we believe it provides to both management and investors additional information with respect to the performance of our fundamental business activities and a comparison of the results of our operations from period to period and against our peers without regard to our financing methods or capital structure. We exclude the items listed above from net income (loss) in arriving at Adjusted EBITDA because these amounts can vary substantially from company to company within our industry depending upon accounting methods and book values of assets, capital structures and the method by which the assets were acquired. Adjusted EBITDA should not be construed as an alternative to the GAAP measure of net income (loss). Our computations of Adjusted EBITDA may not be the same as similarly titled measures of other companies.
PATTERSON-UTI ENERGY, INC.
Non-GAAP Financial Measures
Adjusted Gross Profit Reconciliations
(unaudited, dollars in thousands)
The following table reconciles Adjusted gross profit to gross profit, which we believe is the financial measure calculated and presented in accordance with GAAP that is most directly comparable to Adjusted gross profit.
Three Months Ended | ||||||||||
March 31, | December 31, | March 31, | ||||||||
2026 | 2025 | 2025 | ||||||||
Drilling Services |
|
|
| |||||||
Revenues | $ | 351,717 | $ | 360,777 | $ | 412,860 | ||||
Less direct operating costs | (217,861 | ) | (228,426 | ) | (247,629 | ) | ||||
Less depreciation, amortization and impairment | (83,944 | ) | (85,044 | ) | (84,972 | ) | ||||
GAAP gross profit (loss) | 49,912 | 47,307 | 80,259 | |||||||
Depreciation, amortization and impairment | 83,944 | 85,044 | 84,972 | |||||||
Adjusted gross profit (1) | $ | 133,856 | $ | 132,351 | $ | 165,231 | ||||
Completion Services | ||||||||||
Revenues | $ | 679,587 | $ | 701,560 | $ | 766,080 | ||||
Less direct operating costs | (581,486 | ) | (590,657 | ) | (657,681 | ) | ||||
Less depreciation, amortization and impairment | (111,472 | ) | (110,941 | ) | (115,826 | ) | ||||
GAAP gross profit (loss) | (13,371 | ) | (38 | ) | (7,427 | ) | ||||
Depreciation, amortization and impairment | 111,472 | 110,941 | 115,826 | |||||||
Adjusted gross profit (1) | $ | 98,101 | $ | 110,903 | $ | 108,399 | ||||
Drilling Products | ||||||||||
Revenues | $ | 79,797 | $ | 83,774 | $ | 85,663 | ||||
Less direct operating costs | (46,924 | ) | (49,590 | ) | (46,940 | ) | ||||
Less depreciation, amortization and impairment | (19,846 | ) | (20,515 | ) | (22,876 | ) | ||||
GAAP gross profit (loss) | 13,027 | 13,669 | 15,847 | |||||||
Depreciation, amortization and impairment | 19,846 | 20,515 | 22,876 | |||||||
Adjusted gross profit (1) | $ | 32,873 | $ | 34,184 | $ | 38,723 | ||||
Other | ||||||||||
Revenues | $ | 6,230 | $ | 4,702 | $ | 15,934 | ||||
Less direct operating costs | (2,884 | ) | (3,219 | ) | (9,164 | ) | ||||
Less depreciation, depletion, amortization and impairment | (1,269 | ) | (2,429 | ) | (6,336 | ) | ||||
GAAP gross profit (loss) | 2,077 | (946 | ) | 434 | ||||||
Depreciation, depletion, amortization and impairment | 1,269 | 2,429 | 6,336 | |||||||
Adjusted gross profit (1) | $ | 3,346 | $ | 1,483 | $ | 6,770 | ||||
Adjusted gross profit is considered a non-GAAP financial measure. We define "Adjusted gross profit" as revenues less direct operating costs (excluding depreciation, depletion, amortization and impairment expense). Adjusted gross profit is included as a supplemental disclosure because it is a useful indicator of our operating performance.
CONTACT:
Michael Sabella
Vice President, Investor Relations
(281) 885-7589
SOURCE: Patterson-UTI Energy
View the original press release on ACCESS Newswire
A.Malone--AMWN