
Bank of San Francisco Reports First Quarter Ended March 31, 2026 Financial Results
 Oil prices spike on fresh US-Iran attacks, tech weighs on stocks again

 Spaniard's rare skin disorder ups danger of summer heat

 Protected but deported anyway, as Trump goes after 'dreamers'

 Dodgers face Ohtani knee issues in MLB three-peat bid

 Warriors forward Green details LeBron recruiting pitch

 Massive fire in Bangkok bar kills at least 27

 Zverev vows to chase down Wimbledon champion Sinner in trophy charge

 Five classic France v Spain clashes before World Cup semi-final

 World Cup gets set for pair of blockbuster semi-finals

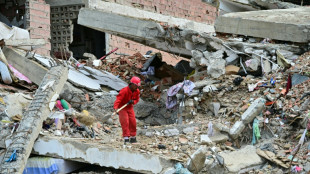 Venezuela quake death toll rises to 4,490

 McGregor says knee fine before first-kick injury, vows return

 Hundred heroine Bhatia says its's 'unbelievable' to be on Lord's honours board

 Irrepressible Sinner outlasts Zverev to win second straight Wimbledon title

 Ryu defeats Henderson in play-off to win back-to-back majors in Evian

 Spain ex-PM draws criticism with 'xenophobic' remark on French team

 Israel elections to be held on October 27: parliament

 Zelensky orders new PM in major government reshuffle

 Van der Poel stays calm in the heat to win Tour de France stage nine

 Iran declares Hormuz strait closed, US military insists traffic flowing

 Marc Marquez cruises to Germany MotoGP victory, enters title race
 Mladenovic and Guo win Wimbledon women's doubles title

 McCullum stands down as England Test cricket coach

 Marc Marquez cruises to Germany MotoGP Grand Prix victory
 Ukraine's Zelensky orders government reshuffle, new PM

 Iran, US trade more strikes as fighting escalates

SAN FRANCISCO, CA / ACCESS Newswire / April 30, 2026 / Bank of San Francisco ("Bank") (OTCQX:BSFO) today reported unaudited net income of $2.0 million, or $0.94 per diluted share for the three months ended March 31, 2026, compared to $2.2 million, or $1.03 per diluted share for the three months ended December 31, 2025, and $1.1 million, or $0.52 per diluted share for the three months ended March 31, 2025.
"First-quarter results continued 2025's positive momentum. While often impacted by seasonal deposit outflows and additional salary expenses, the quarter produced outstanding results in key areas that demonstrate the progress made since the Bank embarked on its growth plan in 2024. Total assets increased 20% and earnings increased 83% from the same quarter in 2025 when many of our growth initiatives began. The additions of experienced individuals to our team and measured investments in operational infrastructure continue to deliver the balance sheet growth that drives profitability. First-quarter deposits increased $32.4 million from the prior quarter, with $10.9 million in non-interest-bearing accounts, while loan closings totaled $60 million. Consistent with our strategic goal to reduce our reliance on residential mortgages, many of the quarter's commitments were commercial lines of credit that have not yet been fully drawn, but are expected to combine with a robust loan pipeline to further drive earning asset growth in the months ahead," said William Keller, Chief Executive Officer.
"The opening celebration of our Laurel Village office in March marked an exciting moment for the Bank and for our continued growth in San Francisco," said Bill Ward, President and Chief Operating Officer. "We were proud to be recognized by District 2 Supervisor Stephen Sherrill with a Certificate of Honor from the San Francisco Board of Supervisors and warmly welcomed by Rodney Fong and the San Francisco Chamber of Commerce. This expansion reflects our focus on thoughtful growth and relationship-driven banking, while further enhancing our ability to serve clients and communities across the city."
Financial Highlights
Total deposits were $670.0 million at March 31, 2026, an increase of $32.4 million, or 5% from December 31, 2025, and $116.5 million, or 21% from March 31, 2025.
Non-interest-bearing demand deposits were $276.4 million at March 31, 2026, an increase of $10.9 million, or 4% from December 31, 2025, and $76.6 million, or 38% from March 31, 2025. Non-interest-bearing deposits accounted for 41.2% of total deposits at March 31, 2026, compared to 36.1% at March 31, 2025.
Interest-bearing deposits were $393.7 million at March 31, 2026, an increase of $21.6 million, or 6% from December 31, 2025, and $39.9 million, or 11% from March 31, 2025. The total cost of funds for the quarter ended March 31, 2026, was 1.15%, a decrease of 0.11% from the quarter ended December 31, 2025, and a decrease of 0.15% from the quarter ended March 31, 2025.
Total loans were $637.0 million at March 31, 2026, an increase of $14.0 million or 2% from December 31, 2025, and an increase of $106.2 million, or 20% from March 31, 2025. Unused commitments in the current quarter increased $23.8 million from December 31, 2025, with new line originations during the quarter.
At March 31, 2026, non-performing loans represented 0.08% of total assets, compared to 0.09% at December 31, 2025, and 0.18% at March 31, 2025. Credit quality remains strong and improved steadily throughout 2025 from the successful resolution of a previously non-performing loan.
Net interest margin (NIM) for the quarter ended March 31, 2026, was 4.47%, compared to 4.44% for the quarter ended December 31, 2025, and 4.19% for the quarter ended March 31, 2025.
Non-interest expenses for the quarter ended March 31, 2026, totaled $5.3 million, an increase of $219,000, or 4% from the quarter ended December 31, 2025, and an increase of $655,000, or 14% from the quarter ended March 31, 2025.
Pre-tax, pre-provision income for the quarter ended March 31, 2026, totaled $3.1 million, a decrease of $226,000, or 7% from the quarter ended December 31, 2025, and an increase of $1.2 million, or 65% from the quarter ended March 31, 2025.
Total shareholders' equity was $85.1 million at March 31, 2026, an increase of $2.1 million, or 2% from December 31, 2025, and an increase of $8.4 million, or 11% from March 31, 2025.
Book value per share was $38.94 at March 31, 2026, an increase of $1.00, or 3% from December 31, 2025, and an increase of $3.59, or 10% from March 31, 2025.
The Bank remained well-capitalized, with all capital ratios exceeding regulatory requirements, including a Tier 1 Leverage Ratio of 11.27%, Tier 1 Risk-Based Capital and Common Equity Tier 1 Ratios of 15.59%, and a Total Risk-Based Capital Ratio of 16.84%.
# # #
Non-GAAP Financial Measure
To supplement our financial statements, which are prepared and presented in accordance with GAAP, we use pre-tax, pre-provision income as a non-GAAP financial measure. Our non-GAAP financial measure does have limitations as analytical tools, and you should not consider pre-tax, pre-provision income in isolation or as a substitute for an analysis of our results under GAAP.
We believe these non-GAAP financial measures provide management and investors with additional information about the financial performance of our business and enable comparison of financial results between periods where certain items may vary independently of business performance. We believe pre-tax, pre-provision income is an important measure because it reflects the financial performance of our business operations. Pre-tax, pre-provision income is a non-GAAP financial measure calculated by subtracting the provision for credit losses and income tax expense from net income.
About Bank of San Francisco
Bank of San Francisco is an independent commercial and private bank built on personal relationships. Founded and headquartered in San Francisco since 2005, the Bank serves individuals, families, businesses, and nonprofits who value direct access to experienced bankers and a single point of contact across every aspect of their financial lives.
With deep community roots and a broad reach, Bank of San Francisco delivers high-touch service and quick decisions, supporting clients wherever life and business take them. Growth is fueled by referrals and the long-term loyalty of clients, colleagues, and community partners. Learn more at www.bankbsf.com.
Forward-Looking Statements
This press release contains certain forward-looking statements that involve risks and uncertainties, including statements relating to new products and anticipated growth. Forward-looking statements are those that are not statements of historical fact and may be identifiable by use of the words "believe," "expect," "intend," "anticipate," "plan," "estimate," "project," or similar expressions. These statements are based on current expectations, estimates and projections about Bank of San Francisco's business based, in part, on assumptions made by management. These statements are not guarantees of future performance and involve risks, uncertainties and assumptions that are difficult to predict. These risks and uncertainties may affect the operations, performance, development, growth, capital needs and results of operations of Bank of San Francisco, and include, but are not limited to, local and national economic conditions; interest rate changes; inflation and monetary policy; changes in the financial performance and/or condition of our loan and deposit clients; changes in the levels of performing and nonperforming assets and charge-offs; timely implementation by Bank of San Francisco of new products and technology enhancements; the impact of competitive products, services and pricing; acts of war, terrorism or civil unrest; the soundness or failure of other financial institutions that may directly or indirectly affect the Bank; potential deposit withdrawals triggered by client concerns following the failures of or risks at other depository institutions; the effect of the COVID-19 pandemic and other infectious illness outbreaks that may arise in the future; natural disasters, such as earthquakes; clients' requirements and preferences; federal, state and local legislation and regulatory developments; the ability to retain or increase market share, retain or grow client relationships and control expenses; changes in regulatory or generally accepted accounting principles and other similar matters. Readers are cautioned not to place undue reliance on forward-looking statements, which are subject to influence by the foregoing risk factors and unanticipated future events. Actual results, accordingly, may differ materially from management's expectations. Bank of San Francisco undertakes no obligation to update such forward-looking statements except as required by law.
Bank of San Francisco
Balance Sheets (Unaudited)
($000, except share and per share amounts)
For the Periods Ended | Year Over Year Change | |||||||||||||||||||||||
Assets | 3/31/2026 | 12/31/2025 | 9/30/2025 | 6/30/2025 | 3/31/2025 | $ | % | |||||||||||||||||
Cash and due from banks | $ | 7,129 | $ | 10,899 | $ | 6,604 | $ | 8,754 | $ | 9,076 | $ | (1,947 | ) | -21 | % | |||||||||
Interest bearing deposits in banks | 84,997 | 60,827 | 74,188 | 78,541 | 69,116 | 15,881 | 23 | % | ||||||||||||||||
Total cash and cash equivalents | 92,126 | 71,726 | 80,792 | 87,295 | 78,192 | 13,934 | 18 | % | ||||||||||||||||
Securities available-for-sale, at fair value | 25,887 | 26,025 | 25,038 | 21,859 | 21,819 | 4,068 | 19 | % | ||||||||||||||||
Loans, net of deferred costs/fees | 637,010 | 623,030 | 581,443 | 550,910 | 530,817 | 106,193 | 20 | % | ||||||||||||||||
Allowance for credit losses | (7,749 | ) | (7,659 | ) | (7,518 | ) | (7,258 | ) | (6,968 | ) | (781 | ) | 11 | % | ||||||||||
Loans, net of allowance of credit losses | 629,261 | 615,371 | 573,925 | 543,652 | 523,849 | 105,412 | 20 | % | ||||||||||||||||
Premises and equipment, net | 3,036 | 2,590 | 1,632 | 1,501 | 1,351 | 1,685 | 125 | % | ||||||||||||||||
Accrued interest receivable & other assets | 17,200 | 17,342 | 17,021 | 17,608 | 13,696 | 3,504 | 26 | % | ||||||||||||||||
Total Assets | $ | 767,510 | $ | 733,054 | $ | 698,408 | $ | 671,915 | $ | 638,907 | $ | 128,603 | 20 | % | ||||||||||
Liabilities | ||||||||||||||
Non-interest bearing deposits | $ | 276,352 | $ | 265,492 | $ | 238,330 | $ | 229,036 | $ | 199,783 | $ | 76,569 | 38 | % |
Interest bearing deposits | 393,651 | 372,073 | 367,669 | 353,188 | 353,748 | 39,903 | 11 | % | ||||||
Total deposits | 670,003 | 637,565 | 605,999 | 582,224 | 553,531 | 116,472 | 21 | % | ||||||
Accrued interest payable and other liabilities | 12,389 | 12,432 | 11,795 | 11,171 | 8,634 | 3,755 | 43 | % | ||||||
Total Liabilities | 682,392 | 649,997 | 617,794 | 593,395 | 562,165 | 120,227 | 21 | % | ||||||
Shareholders' equity | ||||||||||||||
Common stock | 29,614 | 29,490 | 29,261 | 29,075 | 28,944 | 670 | 2 | % | ||||||
Retained earnings | 55,534 | 53,521 | 51,309 | 49,475 | 47,841 | 7,693 | 16 | % | ||||||
Accumulated other comprehensive (loss) income | (30 | ) | 46 | 44 | (30 | ) | (43 | ) | 13 | -30 | % | |||
Total shareholders' equity | 85,118 | 83,057 | 80,614 | 78,520 | 76,742 | 8,376 | 11 | % | ||||||
Total Liabilities & Shareholders' Equity | $ | 767,510 | $ | 733,054 | $ | 698,408 | $ | 671,915 | $ | 638,907 | $ | 128,603 | 20 | % |
Book Value per Common Share | $ | 38.94 | $ | 37.94 | $ | 37.17 | $ | 36.33 | $ | 35.35 | $ | 3.59 | 10 | % |
Total Common Shares Outstanding | 2,185,966 | 2,188,985 | 2,168,841 | 2,161,024 | 2,170,866 | 15,100 | 1 | % | ||||||
Capital Ratios | ||||||||||||||
Tier 1 Leverage ratio | 11.27 | % | 11.16 | % | 11.54 | % | 11.83 | % | 11.41 | % | -0.14 | % | -1 | % |
Tier 1 RBC ratio | 15.59 | % | 16.14 | % | 17.08 | % | 17.68 | % | 18.16 | % | -2.57 | % | -14 | % |
Common Equity Tier 1 RBC ratio | 15.59 | % | 16.14 | % | 17.08 | % | 17.68 | % | 18.16 | % | -2.57 | % | -14 | % |
Total Risk-Based Capital (RBC) ratio | 16.84 | % | 17.39 | % | 18.34 | % | 18.93 | % | 19.41 | % | -2.57 | % | -13 | % |
Other Ratios | ||||||||||||||
Non-interest bearing to Total Deposits | 41.25 | % | 41.64 | % | 39.33 | % | 39.34 | % | 36.09 | % | 5.16 | % | 14 | % |
Loan to Deposit ratio | 95.08 | % | 97.72 | % | 95.95 | % | 94.62 | % | 95.90 | % | -0.82 | % | -1 | % |
Allowance for Credit Losses to Total Loans | 1.22 | % | 1.23 | % | 1.29 | % | 1.32 | % | 1.31 | % | -0.09 | % | -7 | % |
ACL to Nonperforming Loans | 1190.05 | % | 1099.23 | % | 868.68 | % | 642.31 | % | 593.21 | % | 596.84 | % | 101 | % |
Nonperforming Assets to Total Assets | 0.08 | % | 0.09 | % | 0.12 | % | 0.17 | % | 0.18 | % | -0.10 | % | -56 | % |
Bank of San Francisco
Statement of Income (Unaudited)
($000, except share and per share amounts)
Three Months Ended | Year Over Year Change | |||||||||||||||||||||||
3/31/2026 | 12/31/2025 | 9/30/2025 | 6/30/2025 | 3/31/2025 | $ | % | ||||||||||||||||||
Interest on loans, including fees | $ | 8,874 | $ | 8,904 | $ | 8,048 | $ | 7,596 | $ | 7,071 | $ | 1,803 | 25 | % | ||||||||||
Interest on deposits in banks | 751 | 968 | 1,021 | 928 | 677 | 74 | 11 | % | ||||||||||||||||
Interest on investment securities | 246 | 247 | 208 | 210 | 221 | 25 | 11 | % | ||||||||||||||||
Other interest income | 181 | 79 | 77 | 72 | 74 | 107 | 145 | % | ||||||||||||||||
Total interest income | 10,052 | 10,198 | 9,354 | 8,806 | 8,043 | 2,009 | 25 | % | ||||||||||||||||
Deposits interest expense | 1,858 | 2,054 | 1,936 | 1,868 | 1,719 | 139 | 8 | % | ||||||||||||||||
Other interest expense | - | - | - | - | - | - | 0 | % | ||||||||||||||||
Total interest expense | 1,858 | 2,054 | 1,936 | 1,868 | 1,719 | 139 | 8 | % | ||||||||||||||||
Net interest income | 8,194 | 8,144 | 7,418 | 6,938 | 6,324 | 1,870 | 30 | % | ||||||||||||||||
Provision for credit losses | 200 | 300 | 330 | 290 | 300 | (100 | ) | -33 | % | |||||||||||||||
Net interest income after provision | 7,994 | 7,844 | 7,088 | 6,648 | 6,024 | 1,970 | 33 | % | ||||||||||||||||
Service charges on deposits | 103 | 129 | 111 | 108 | 102 | 1 | 1 | % | ||||||||||||||||
Other non-interest income | 49 | 80 | 15 | (5 | ) | 61 | (12 | ) | -20 | % | ||||||||||||||
Total non-interest income | 152 | 209 | 126 | 103 | 163 | (11 | ) | -7 | % | |||||||||||||||
Salaries and employee benefits expense | 3,345 | 3,258 | 2,720 | 2,885 | 3,033 | 312 | 10 | % | ||||||||||||||||
Occupancy | 402 | 372 | 366 | 336 | 291 | 111 | 38 | % | ||||||||||||||||
Information Technology and Equipment | 391 | 342 | 340 | 324 | 315 | 76 | 24 | % | ||||||||||||||||
Other operating expense | 1,140 | 1,087 | 1,181 | 880 | 984 | 156 | 16 | % | ||||||||||||||||
Total non-interest expense | 5,278 | 5,059 | 4,607 | 4,425 | 4,623 | 655 | 14 | % | ||||||||||||||||
Income before income taxes | 2,868 | 2,994 | 2,607 | 2,326 | 1,564 | 1,304 | 83 | % | ||||||||||||||||
Income tax expense | 854 | 783 | 772 | 692 | 466 | 388 | 83 | % | ||||||||||||||||
Net income | $ | 2,014 | $ | 2,211 | $ | 1,835 | $ | 1,634 | $ | 1,098 | $ | 916 | 83 | % | ||||||||||
Basic Earnings per Share | $ | 0.95 | $ | 1.05 | $ | 0.87 | $ | 0.78 | $ | 0.53 | $ | 0.42 | 79 | % | ||||||||||
Average Shares Outstanding | 2,117,290 | 2,109,522 | 2,108,663 | 2,097,194 | 2,090,394 | 26,896 | 1 | % | ||||||||||||||||
Diluted Earnings per Share | $ | 0.94 | $ | 1.03 | $ | 0.86 | $ | 0.77 | $ | 0.52 | $ | 0.42 | 81 | % | ||||||||||
Average Shares Outstanding | 2,132,083 | 2,136,558 | 2,134,102 | 2,124,402 | 2,130,962 | 1,121 | 0 | % | ||||||||||||||||
Annualized Performance Ratios | ||||||||||||||||||||||||
Return on Average Assets | 1.07 | % | 1.19 | % | 1.05 | % | 0.98 | % | 0.70 | % | 0.37 | % | 53 | % | ||||||||||
Return on Average Common Equity | 9.58 | % | 10.81 | % | 9.22 | % | 8.32 | % | 5.78 | % | 3.80 | % | 66 | % | ||||||||||
Net Interest Margin | 4.47 | % | 4.44 | % | 4.33 | % | 4.28 | % | 4.19 | % | 0.28 | % | 7 | % | ||||||||||
Cost of Funds | 1.15 | % | 1.26 | % | 1.27 | % | 1.30 | % | 1.30 | % | -0.15 | % | -12 | % | ||||||||||
Efficiency Ratio | 63.24 | % | 60.57 | % | 61.07 | % | 62.85 | % | 71.27 | % | -8.03 | % | -11 | % | ||||||||||
Reconciliation of GAAP to Non-GAAP Financial Measures | ||||||||||||||||||||||||
Net income | $ | 2,014 | $ | 2,211 | $ | 1,835 | $ | 1,634 | $ | 1,098 | $ | 916 | 83 | % | ||||||||||
Provision for credit losses | 200 | 300 | 330 | 290 | 300 | (100 | ) | -33 | % | |||||||||||||||
Income tax expense | 854 | 783 | 772 | 692 | 466 | 388 | 83 | % | ||||||||||||||||
Pre-tax, pre-provision income | $ | 3,068 | $ | 3,294 | $ | 2,937 | $ | 2,616 | $ | 1,864 | $ | 1,204 | 65 | % | ||||||||||
Media Contact
Leslie Katter
[email protected]
SOURCE: Bank of San Francisco
View the original press release on ACCESS Newswire
D.Cunningha--AMWN