
-
 West Indies edge New Zealand despite Santner brilliance
-
French pair released by Iran await return home

-
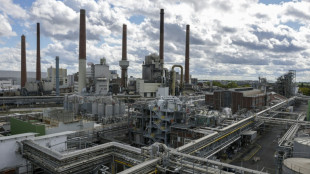 German factory orders up but outlook still muted
-
Death toll tops 100 as Philippines digs out after typhoon

-
 Attack on key city in Sudan's Kordofan region kills 40: UN
-
'No one could stop it': Sudanese describe mass rapes while fleeing El-Fasher

-
 Champagne and cheers across New York as Mamdani soars to victory
-
Medieval tower collapse adds to Italy's workplace toll

-
 BMW boosts profitability despite China, tariff woes
-
South Africa's Wiese wary of 'hurt' France before re-match

-
 Asian markets sink as tech bubble fears grow
-
Beyond limits: Croatian freediver's breathtaking record

-
 Tottenham supporting Udogie after alleged gun threat in London
-
Thunder roll Clippers to stay unbeaten as SGA keeps streak alive

-
 In appeal, Australian mushroom murderer alleges 'miscarriage of justice'
-
Toyota hikes profit forecasts 'despite US tariffs'

-
 Typhoon death toll soars past 90 in the Philippines
-
Ex-France lock Willemse challenges Meafou to become 'the bully'

-
 Ukrainians to honour sporting dead by building country they 'died for': minister
-
At least 7 dead after UPS cargo plane crashes near Louisville airport

-
 US Supreme Court hears challenge to Trump tariff powers
-
US government shutdown becomes longest in history

-
 India's Modi readies bellwether poll in poorest state
-
Green goals versus growth needs: India's climate scorecard
-
 Where things stand on China-US trade after Trump and Xi talk
-
Sri Lanka targets big fish in anti-corruption push

-
 NY elects leftist mayor on big election night for Democrats
-
Injured Jordie Barrett to miss rest of All Blacks tour

-
 Asian markets tumble as tech bubble fears grow
-
Pay to protect: Brazil pitches new forest fund at COP30

-
 Australia pick 'impressive' Weatherald in first Ashes Test squad
-
Iraq's social media mercenaries dying for Russia

-
 Young leftist Trump foe elected New York mayor
-
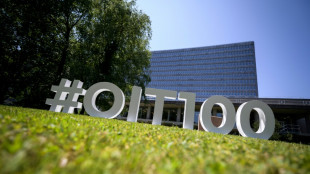
Concerns at ILO over expected appointment of close Trump advisor
-
 Venus Williams to return to Auckland Classic at the age of 45
-
No deal yet on EU climate targets as COP30 looms

-
 Typhoon death toll climbs to 66 in the Philippines
-
NATO tests war preparedness on eastern flank facing Russia

-
 Uncapped opener Weatherald in Australia squad for first Ashes Test
-
CelLBxHealth PLC Presents Proof-of-Concept Study

-
 Evotec SE Reports 9M 2025 Results: Continued Strong Execution on Strategic Priorities
-
Coca-Cola Europacific Partners plc Announces Q3 Trading Update & Interim Dividend Declaration

-
 Sassy Gold Announces Cease Trade Order
-
Gander Gold Announces Cease Trade Order

-
 Ternium to Acquire Nippon Groups' Remainder Participation in Usiminas' Control Group
-
Liverpool down Real Madrid in Champions League, Bayern edge PSG

-
 Van Dijk tells Liverpool to keep calm and follow Arsenal's lead
-
PSG left to sweat on injuries to Dembele and Hakimi

-
 Reddit, Kick to be included in Australia's social media ban
-
Ex-Zimbabwe cricket captain Williams treated for 'drug addiction'


Stabilis Solutions Announces Second Quarter 2025 Results
HOUSTON, TX / ACCESS Newswire / August 6, 2025 / Stabilis Solutions, Inc., ("Stabilis" or the "Company") (Nasdaq:SLNG), a leading provider of clean fueling, production, storage, and last mile delivery solutions for many of the world's most recognized, high-performance brands, today announced financial results for the second quarter ended June 30, 2025.
SECOND QUARTER 2025 HIGHLIGHTS
Revenues of $17.3 million
Net loss of ($0.6) million
Adjusted EBITDA of $1.5 million
Cash flow from operations of $4.5 million
$12.2 million of cash and $3.9 million of availability under credit agreements as of June 30, 2025
MANAGEMENT COMMENTARY
"We continued to advance our long-term business development and growth strategy by deepening engagement with customers across marine, aerospace, and power generation end-markets with a focus on securing the long-term contracts needed to grow our operations," stated Casey Crenshaw, Executive Chairman and Interim President & Chief Executive Officer. " Demand for our turnkey small-scale LNG solutions remains strong, underpinned by continued growth in commercial space applications. These trends reinforce our position as the provider of choice within our markets, and we are prepared to invest in additional LNG infrastructure in response to emerging commercial opportunities."
"Total revenue declined year-over-year in the second quarter, due to the successful completion of a large, short duration commercial project late in 2024. However, we are gaining momentum in our key high growth aerospace, marine and power generation markets, which together increased 15% year-over-year, reflecting growing demand for our solutions in high-performance and mission critical applications," continued Crenshaw. "This reinforces our confidence in the long-term fundamentals of our business, as we deepen relationships with both new and existing customers and benefit from the continued growth in LNG fuel applications."
"We remain focused on generating operating cash flows and maintaining a strong balance sheet and liquidity to support our long-term growth strategy," stated Andy Puhala, Chief Financial Officer. "As of the end of the second quarter, we had over $16 million in cash and available liquidity, providing us with the ability to continue investing in both capital expenditures and operating investments to support value creation for stakeholders."
STRATEGIC AND OPERATIONAL UPDATE
Strong momentum in key growth markets. Since the second quarter of last year, Stabilis' revenue mix in high-growth marine, power generation and aerospace end-markets increased from 62% of total revenue to nearly 77% in the second quarter of 2025. Demand within these end-markets is driven by multi-year trends such as the commercialization of the aerospace industry and the transition of marine vessels to LNG. The Company is actively pursuing further commercial opportunities to expand relationships with both new and existing customers within these end-markets.
Consistent cash conversion supports balance sheet versatility and growth investment potential. Stabilis' efficient cost structure and working capital utilization has continued to drive robust free cash flow conversion and a strengthening liquidity position. The Company continues to allocate capital and operating expenses toward growth initiatives and since the beginning of the year has invested $1.2 million in capital expenditures for growth initiatives.
FINANCIAL PERFORMANCE SUMMARY
Revenue for the second quarter of 2025 was $17.3 million, a decrease of 7% compared to the second quarter of 2024. The decrease in revenue compared to the prior year period was primarily attributable to the successful completion of a large industrial customer contract, partly offset by higher revenues associated with aerospace and power generation customers.
Net loss for the second quarter of 2025 was ($0.6) million, or ($0.03) per diluted share, compared to net income of $27 thousand or $0.00 per diluted share in the second quarter of 2024. The decrease in net income compared to the prior year period reflects the decrease in net revenues, including lower equipment and labor revenues on a completed customer contract, partly offset by a $0.2 million reduction in selling, general and administrative expenses in the second quarter of 2025.
Adjusted EBITDA for the second quarter of 2025 was $1.5 million, compared to $2.1 million, in the second quarter of last year. The decrease in Adjusted EBITDA year-over-year is primarily attributable to lower revenues including lower equipment and labor revenues on a completed customer contract.
SECOND QUARTER 2025 CONFERENCE CALL AND WEBCAST
Stabilis will host a conference call on Thursday August 7, 2025, at 9:00 a.m. ET to review the Company's financial results and conduct a question-and-answer session.
A webcast of the conference call will be available in the Investor Relations section of the Company's corporate website at https://investors.stabilis-solutions.com/events. To listen to a live broadcast, go to the site at least 15 minutes prior to the scheduled start time in order to register, download, and install any necessary audio software.
To participate in the live teleconference:
Domestic Live: | 833-316-1983 |
International Live: | 785-838-9310 |
Conference ID: | SLNGQ225 |
To listen to a replay of the teleconference, which will be available through August 14, 2025:
Domestic Live: | 800-695-2533 |
International Live: | 402-530-9029 |
ABOUT STABILIS SOLUTIONS
Stabilis Solutions is a leading provider of clean fueling, production, storage, and last mile delivery solutions for many of the world's most recognized, high-performance brands. To learn more, visit www.stabilis-solutions.com.
CAUTIONARY STATEMENTS REGARDING FORWARD-LOOKING STATEMENTS
This press release includes "forward-looking statements" within the meaning of the safe harbor provisions of the U.S. Private Securities Litigation Reform Act of 1995 and within the meaning of Section 27a of the Securities Act of 1933, as amended, and Section 21e of the Securities Exchange Act of 1934, as amended. Any actual results may differ from expectations, estimates and projections presented or implied and, consequently, you should not rely on these forward-looking statements as predictions of future events. Words such as "can," "believes," "feels," "anticipates," "expects," "could," "will," "plan," "may," "should," "predicts," "potential" and similar expressions are intended to identify such forward-looking statements.
Such forward-looking statements relate to future events or future performance, but reflect our current beliefs, based on information currently available. Most of these factors are outside our control and are difficult to predict. A number of factors could cause actual events, performance or results to differ materially from the events, performance and results discussed in the forward-looking statements. Factors that may cause such differences include, among other things: the future performance of Stabilis, future demand for and price of LNG, availability and price of natural gas, unexpected costs, and general economic conditions.
The foregoing list of factors is not exclusive. Additional information concerning these and other risk factors is contained in the Risk Factors in Item 1A of our Annual Report on Form 10-K filed with the Securities and Exchange Commission on February 25, 2025 which is available on the SEC's website at www.sec.gov or on the Investors section of our website at www.stabilis-solutions.com. All subsequent written and oral forward-looking statements concerning Stabilis, or other matters attributable to Stabilis, or any person acting on its behalf are expressly qualified in their entirety by the cautionary statements above. Readers are cautioned not to place undue reliance upon any forward-looking statements, which speak only as of the date made. Stabilis does not undertake or accept any obligation or undertaking to release publicly any updates or revisions to any forward-looking statement to reflect any change in their expectations or any change in events, conditions or circumstances on which any such statement is based, except as required by law.
Stabilis Solutions, Inc. and Subsidiaries
Selected Consolidated Operating Results
(Unaudited, in thousands, except share and per share data)
Three Months Ended | Six Months Ended | |||||||||||||||
June 30, | March 31, | June 30, | June 30, | June 30, | ||||||||||||
2025 | 2025 | 2024 | 2025 | 2024 | ||||||||||||
Revenues: | ||||||||||||||||
Revenues | $ | 17,309 | $ | 17,338 | $ | 18,598 | $ | 34,647 | $ | 38,368 | ||||||
Operating expenses: | ||||||||||||||||
Cost of revenues | 12,724 | 12,788 | 13,550 | 25,512 | 27,064 | |||||||||||
Change in unrealized (gain) loss on natural gas derivatives | 60 | (84 | ) | (82 | ) | (24 | ) | (334 | ) | |||||||
Selling, general and administrative expenses | 3,131 | 4,933 | 3,331 | 8,064 | 6,787 | |||||||||||
Gain from disposal of fixed assets | - | (103 | ) | (72 | ) | (103 | ) | (199 | ) | |||||||
Depreciation expense | 1,860 | 1,867 | 1,768 | 3,727 | 3,568 | |||||||||||
Total operating expenses | 17,775 | 19,401 | 18,495 | 37,176 | 36,886 | |||||||||||
Income (loss) from operations before equity income | (466 | ) | (2,063 | ) | 103 | (2,529 | ) | 1,482 | ||||||||
Net equity income from foreign joint venture operations | 50 | 368 | 295 | 418 | 492 | |||||||||||
Income (loss) from operations | (416 | ) | (1,695 | ) | 398 | (2,111 | ) | 1,974 | ||||||||
Other income (expense): | ||||||||||||||||
Interest income (expense), net | 24 | 21 | 28 | 45 | 24 | |||||||||||
Other income (expense), net | (24 | ) | (12 | ) | 26 | (36 | ) | 5 | ||||||||
Total other income (expense) | - | 9 | 54 | 9 | 29 | |||||||||||
Net income (loss) before income tax (benefit) expense | (416 | ) | (1,686 | ) | 452 | (2,102 | ) | 2,003 | ||||||||
Income tax (benefit) expense | 197 | (88 | ) | 425 | 109 | 507 | ||||||||||
Net income (loss) | $ | (613 | ) | $ | (1,598 | ) | $ | 27 | $ | (2,211 | ) | $ | 1,496 | |||
Net income (loss) per common share: | ||||||||||||||||
Basic and diluted per common share | $ | (0.03 | ) | $ | (0.09 | ) | $ | 0.00 | $ | (0.12 | ) | $ | 0.08 | |||
EBITDA | $ | 1,420 | $ | 160 | $ | 2,192 | $ | 1,580 | $ | 5,547 | ||||||
Adjusted EBITDA | $ | 1,480 | $ | 2,069 | $ | 2,110 | $ | 3,549 | $ | 5,213 | ||||||
Stabilis Solutions, Inc. and Subsidiaries
Condensed Consolidated Balance Sheets
(Unaudited, in thousands, except share and per share data)
June 30, | December 31, | |||
2025 | 2024 | |||
Assets | ||||
Current assets: | ||||
Cash and cash equivalents | $ | 12,220 | $ | 8,987 |
Accounts receivable, net | 4,397 | 6,239 | ||
Inventories, net | 180 | 345 | ||
Prepaid expenses and other current assets | 1,039 | 1,902 | ||
Total current assets | 17,836 | 17,473 | ||
Property, plant and equipment: | ||||
Cost | 118,596 | 117,246 | ||
Less accumulated depreciation | (69,048 | ) | (65,518 | ) |
Property, plant and equipment, net | 49,548 | 51,728 | ||
Goodwill | 4,314 | 4,314 | ||
Investments in foreign joint ventures | 10,760 | 11,659 | ||
Right-of-use assets and other noncurrent assets | 786 | 410 | ||
Total assets | $ | 83,244 | $ | 85,584 |
Liabilities and Stockholders' Equity | ||||
Current liabilities: | ||||
Accounts payable | $ | 5,950 | $ | 5,667 |
Accrued liabilities | 3,456 | 3,566 | ||
Current portion of long-term notes payable | 1,295 | 2,010 | ||
Current portion of finance and operating lease obligations | 640 | 384 | ||
Total current liabilities | 11,341 | 11,627 | ||
Long-term notes payable, net of current portion and debt issuance costs | 6,336 | 6,848 | ||
Long-term portion of operating lease obligations | 85 | 101 | ||
Total liabilities | 17,762 | 18,576 | ||
Commitments and contingencies | ||||
Stockholders' equity: | ||||
Common stock; $0.001 par value, 37,500,000 shares authorized, 18,596,301 and 18,585,014 shares issued and outstanding at June 30, 2025 and December 31, 2024, respectively | 19 | 19 | ||
Additional paid-in capital | 103,644 | 103,214 | ||
Accumulated other comprehensive loss | (323 | ) | (578 | ) |
Accumulated deficit | (37,858 | ) | (35,647 | ) |
Total stockholders' equity | 65,482 | 67,008 | ||
Total liabilities and stockholders' equity | $ | 83,244 | $ | 85,584 |
Stabilis Solutions, Inc. and Subsidiaries
Condensed Consolidated Statements of Cash Flows
(Unaudited, in thousands)
Three Months Ended | Six Months Ended | |||||||||||||||
June 30, | March 31, | June 30, | June 30, | June 30, | ||||||||||||
2025 | 2025 | 2024 | 2025 | 2024 | ||||||||||||
Cash flows from operating activities: | ||||||||||||||||
Net income (loss) | $ | (613 | ) | $ | (1,598 | ) | $ | 27 | $ | (2,211 | ) | $ | 1,496 | |||
Adjustments to reconcile net income (loss) to net cash provided by operating activities: | ||||||||||||||||
Depreciation | 1,860 | 1,867 | 1,768 | 3,727 | 3,568 | |||||||||||
Stock-based compensation expense | - | 447 | 408 | 447 | 791 | |||||||||||
Bad debt expense (recovery) | 106 | 7 | (100 | ) | 113 | 68 | ||||||||||
Gain on disposal of assets | - | (103 | ) | (72 | ) | (103 | ) | (199 | ) | |||||||
Income from equity investment in joint venture | (120 | ) | (417 | ) | (340 | ) | (537 | ) | (587 | ) | ||||||
Cash settlements from natural gas derivatives, net | 76 | 163 | (359 | ) | 239 | (359 | ) | |||||||||
Realized and unrealized (gains) losses on natural gas derivatives, net | 225 | (84 | ) | 30 | 141 | 30 | ||||||||||
Distributions from equity investment in joint venture | 1,637 | - | 1,716 | 1,637 | 1,716 | |||||||||||
Changes in operating assets and liabilities: | ||||||||||||||||
Accounts receivable | 205 | 1,540 | (228 | ) | 1,745 | 1,736 | ||||||||||
Prepaid expenses and other current assets | 213 | 423 | 445 | 636 | 680 | |||||||||||
Accounts payable and accrued liabilities | 898 | (1,229 | ) | 1,679 | (331 | ) | (133 | ) | ||||||||
Other | 28 | 9 | 64 | 37 | 160 | |||||||||||
Net cash provided by operating activities | 4,515 | 1,025 | 5,038 | 5,540 | 8,967 | |||||||||||
Cash flows from investing activities: | ||||||||||||||||
Acquisition of fixed assets | (635 | ) | (487 | ) | (1,376 | ) | (1,122 | ) | (2,249 | ) | ||||||
Proceeds from sale of fixed assets | - | 211 | 72 | 211 | 279 | |||||||||||
Net cash used in investing activities | (635 | ) | (276 | ) | (1,304 | ) | (911 | ) | (1,970 | ) | ||||||
Cash flows from financing activities: | ||||||||||||||||
Payments on short- and long-term notes payable and finance leases | (680 | ) | (671 | ) | (529 | ) | (1,351 | ) | (875 | ) | ||||||
Payment of debt issuance costs | - | (42 | ) | - | (42 | ) | - | |||||||||
Employee tax payments from restricted stock withholdings | - | (17 | ) | - | (17 | ) | (9 | ) | ||||||||
Net cash used in financing activities | (680 | ) | (730 | ) | (529 | ) | (1,410 | ) | (884 | ) | ||||||
Effect of exchange rate changes on cash | 17 | (3 | ) | (8 | ) | 14 | (4 | ) | ||||||||
Net increase in cash and cash equivalents | 3,217 | 16 | 3,197 | 3,233 | 6,109 | |||||||||||
Cash and cash equivalents, beginning of period | 9,003 | 8,987 | 8,286 | 8,987 | 5,374 | |||||||||||
Cash and cash equivalents, end of period | $ | 12,220 | $ | 9,003 | $ | 11,483 | $ | 12,220 | $ | 11,483 | ||||||
Non-GAAP Measures
Our management uses EBITDA and Adjusted EBITDA to assess the performance and operating results of our business. EBITDA is defined as Earnings before Interest (includes interest income and interest expense), Taxes, Depreciation and Amortization. Adjusted EBITDA is defined as EBITDA further adjusted for certain special items that occur during the reporting period, as noted below. We include EBITDA and Adjusted EBITDA to provide investors with a supplemental measure of our operating performance. Neither EBITDA nor Adjusted EBITDA is a recognized term under generally accepted accounting principles in the U.S. ("GAAP"). Accordingly, they should not be used as an indicator of, or an alternative to, net income (loss) as a measure of operating performance. In addition, EBITDA and Adjusted EBITDA are not intended to be measures of free cash flow available for management's discretionary use, as they do not consider certain cash requirements, such as debt service requirements. Because the definition of EBITDA and Adjusted EBITDA may vary among companies and industries, it may not be comparable to other similarly titled measures used by other companies. The following table provides a reconciliation of net income (loss), the most directly comparable GAAP measure, to EBITDA and Adjusted EBITDA (in thousands).
Three Months Ended | Six Months Ended | |||||||||||||||
June 30, | March 31, | June 30, | June 30, | June 30, | ||||||||||||
2025 | 2025 | 2024 | 2025 | 2024 | ||||||||||||
Net income (loss) | $ | (613 | ) | $ | (1,598 | ) | $ | 27 | $ | (2,211 | ) | $ | 1,496 | |||
Depreciation | 1,860 | 1,867 | 1,768 | 3,727 | 3,568 | |||||||||||
Interest expense (income), net | (24 | ) | (21 | ) | (28 | ) | (45 | ) | (24 | ) | ||||||
Income tax (benefit) expense | 197 | (88 | ) | 425 | 109 | 507 | ||||||||||
EBITDA | 1,420 | 160 | 2,192 | 1,580 | 5,547 | |||||||||||
Special items* | 60 | 1,909 | (82 | ) | 1,969 | (334 | ) | |||||||||
Adjusted EBITDA | $ | 1,480 | $ | 2,069 | $ | 2,110 | $ | 3,549 | $ | 5,213 | ||||||
* Special items for all periods presented consist of adjustments related to unrealized (gain)/loss on natural gas derivatives. The three months ended March 31, 2025 and the six months ended June 30, 2025 also include an add-back of $2.1 million related to Mr. Ballard's severance expenses and a subtraction of $0.1 million for a gain related to a property damage settlement.
# # # # #
Investor Contact:
Andrew Puhala
Chief Financial Officer
832-456-6502
[email protected]
SOURCE: Stabilis Solutions
View the original press release on ACCESS Newswire
L.Mason--AMWN


