
Trinity Bank Reports 2025 2nd Quarter Net Income up 10.2% to $ 2,374,000 - Return on Assets 1.79%
 General Hospital actor Randall England dies at 75

 London museum removes Russell Brand hair exhibit after rape conviction

 Yella Beezy sentenced to life for arranging rapper Mo3’s murder

 Authorities to identify Montauk Mary and five other Long Island cold-case victims

 Barbie sequel negotiations stall over reported $25 million pay packages

 Bath & Body Works launches buy-one-get-one-free candle offer

 Itlu Arjuna receives U/A certificate ahead of theatrical release

 Niraj Kumar earns Los Angeles Olympic quota with 50m rifle bronze

 India extends micro-credit guarantee plan for five years

 Pradeep Antony, Smeha Manimegalai portray secret spouses in Mr & Mrs Office

 Woman barred from every Greggs outlet after series of offences

 Ketchup packets link suspect to break-in at Eddie Rocket’s restaurant

 Spain's General Strike Links Housing Crisis to Lost Purchasing Power

 China's Factory Inflation Accelerates While Consumer Demand Stays Weak

 Bank of England Raises Interest Rate to 4% as Energy Risks Intensify

 OPEC Says Oil Output Is Near Prewar Levels Despite Shipping Disruptions

 China's Singles' Day Exposes Persistent Consumer Caution

 Irish police prepare for further hoax bomb threats after hundreds of schools targeted

 RBA Inflation Target Origins: Why Australia Chose a Range Over Zero

 Sister recounts fatal machete attack as Irish murder trial continues

 HoloCoder technology promises brighter smartphone images and 3D depth data

 Early Black Friday Walking Pad Deals: Urevo and WalkingPad Discounts

 Radical Numerics develops offline AI tool to detect engineered pathogens

 Kiara Advani Reveals Sidharth Malhotra’s Reaction to Toxic Backlash

 Four firms compete to design Chennai’s model mobility corridors

FORT WORTH, TX / ACCESS Newswire / July 31, 2025 / Trinity Bank N.A. (OTC PINK:TYBT) today announced operating results for the three months ending June 30, 2025, and YTD results for the six months ending June 30, 2025.
Results of Operations
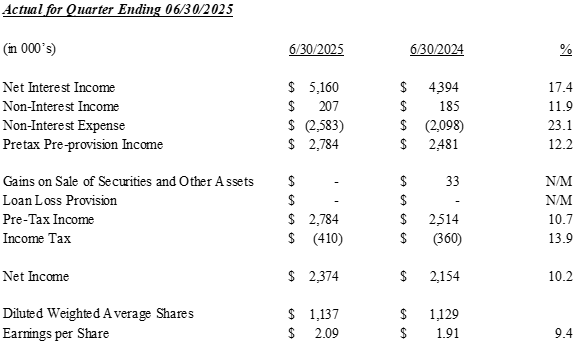
Trinity Bank, N.A. reported Net Income after Taxes of $2,374,000 or $2.09 per diluted common share for the first quarter of 2025, compared to $2,1543,000 or $1.91 per diluted common share for the second quarter of 2024, an increase of 9.4%.
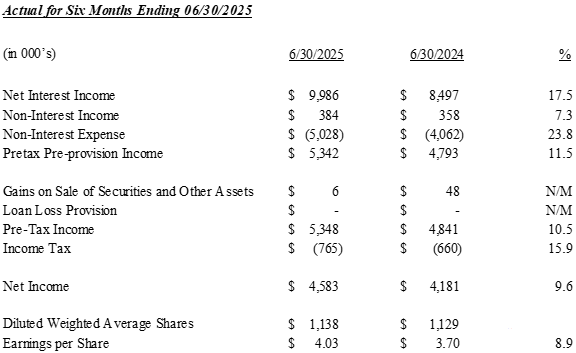
For the first six months of 2025, Net Income after Taxes amounted to $4,583,000, an increase of 9.6% over the first half of 2024 results of $4,181,000. Earnings per diluted common share for the first half of 2025 were $4.03, an increase of 8.7% over the first half of 2024 results of $3.70 per diluted common share.
Steve Lombardi, Chief Lending Officer, stated, "The second quarter represents record earnings for Trinity Bank and our single best quarter of performance since the Bank was founded in 2003. We are very pleased with the results, which demonstrate the continued success of a business model based on exceptional customer relationships and the strength of the entire Trinity Bank team.
As we move into the second half of the year, we will continue executing on a growth focused strategy, without sacrificing the high credit standards that have made Trinity Bank what it is. Despite some macro-economic uncertainty, primarily related to international trade, the business environment in North Texas remains stable and our customer base remains largely unaffected.
While our outlook for loan growth and credit quality remains positive for the rest of 2025, we are also well positioned to weather any unforeseen storms given our strong liquidity and capital positions."
Page 2 - Trinity Bank Second Quarter 2025
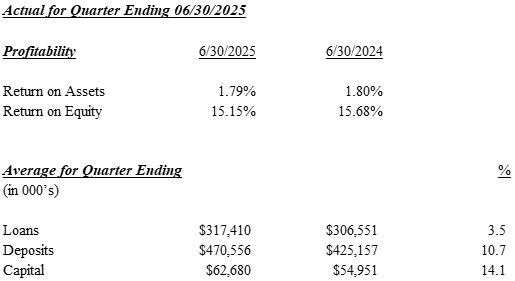
Page 3 - Trinity Bank Second Quarter 2025
Trinity Bank, N.A. is a commercial bank that began operations May 28, 2003. For a full financial statement, visit Trinity Bank's website: www.trinitybk.com Regulatory reporting format is also available at www.fdic.gov.
###
For information contact:
Richard Burt
Executive Vice President
Trinity Bank
817-763-9966
This Press Release may contain certain forward-looking statements within the meaning of the Private Securities Litigation Reform Act of 1995 regarding future financial conditions, results of operations and the Bank's business operations. Such forward-looking statements involve risks, uncertainties and assumptions, including, but not limited to, monetary policy and general economic conditions in Texas and the greater Dallas-Fort Worth metropolitan area, the risks of changes in interest rates on the level and composition of deposits, loan demand and the values of loan collateral, securities and interest rate protection agreements, the actions of competitors and customers, the success of the Bank in implementing its strategic plan, the failure of the assumptions underlying the reserves for loan losses and the estimations of values of collateral and various financial assets and liabilities, that the costs of technological changes are more difficult or expensive than anticipated, the effects of regulatory restrictions imposed on banks generally, any changes in fiscal, monetary or regulatory policies and other uncertainties as discussed in the Bank's Registration Statement on Form SB‑1 filed with the Office of the Comptroller of the Currency. Should one or more of these risks or uncertainties materialize, or should these underlying assumptions prove incorrect, actual outcomes may vary materially from outcomes expected or anticipated by the Bank. A forward-looking statement may include a statement of the assumptions or bases underlying the forward‑looking statement. The Bank believes it has chosen these assumptions or bases in good faith and that they are reasonable. However, the Bank cautions you that assumptions or bases almost always vary from actual results, and the differences between assumptions or bases and actual results can be material. The Bank undertakes no obligation to publicly update or otherwise revise any forward‑looking statements, whether as a result of new information, future events or otherwise, unless the securities laws require the Bank to do so.
TRINITY BANK N.A. | ||||||||||||||||||||||||
(Unaudited) | ||||||||||||||||||||||||
(Dollars in thousands, except per share data) | ||||||||||||||||||||||||
Quarter Ended | Six Months Ending | |||||||||||||||||||||||
June 30 | % | June 30 | % | |||||||||||||||||||||
EARNINGS SUMMARY | 2025 | 2024 | Change | 2025 | 2024 | Change | ||||||||||||||||||
Interest income | $ | 7,455 | $ | 7,107 | 4.9 | % | $ | 14,430 | $ | 14,041 | 2.8 | % | ||||||||||||
Interest expense | 2,295 | 2,713 | -15.4 | % | 4,444 | 5,544 | -19.8 | % | ||||||||||||||||
Net Interest Income | 5,160 | 4,394 | 17.4 | % | 9,986 | 8,497 | 17.5 | % | ||||||||||||||||
Service charges on deposits | 76 | 64 | 18.8 | % | 146 | 120 | 21.6 | % | ||||||||||||||||
Other income | 131 | 121 | 8.3 | % | 238 | 238 | 0.0 | % | ||||||||||||||||
Total Non Interest Income | 207 | 185 | 11.9 | % | 384 | 358 | 7.3 | % | ||||||||||||||||
Salaries and benefits expense | 1,731 | 1,319 | 31.2 | % | 3,239 | 2,541 | 27.5 | % | ||||||||||||||||
Occupancy and equipment expense | 140 | 122 | 14.8 | % | 263 | 244 | 7.8 | % | ||||||||||||||||
Other expense | 712 | 657 | 8.4 | % | 1,526 | 1,277 | 19.5 | % | ||||||||||||||||
Total Non Interest Expense | 2,583 | 2,098 | 23.1 | % | 5,028 | 4,062 | 23.8 | % | ||||||||||||||||
Pretax pre-provision income | 2,784 | 2,481 | 12.2 | % | 5,342 | 4,793 | 11.5 | % | ||||||||||||||||
Gain on sale of Securities | 0 | (4 | ) | N/M | 6 | (4 | ) | N/M | ||||||||||||||||
Gain on sale of Assets | 0 | 36 | N/M | 0 | 53 | N/M | ||||||||||||||||||
Provision for Loan Losses | 0 | 0 | N/M | 0 | 0 | N/M | ||||||||||||||||||
Earnings before income taxes | 2,784 | 2,514 | 10.7 | % | 5,348 | 4,841 | 10.5 | % | ||||||||||||||||
Provision for income taxes | 410 | 360 | 13.9 | % | 765 | 660 | 15.9 | % | ||||||||||||||||
Net Earnings | $ | 2,374 | $ | 2,154 | 10.2 | % | $ | 4,583 | $ | 4,181 | 9.6 | % | ||||||||||||
Basic earnings per share | 2.18 | 2.00 | 2.5 | % | 4.21 | 3.87 | 8.7 | % | ||||||||||||||||
Basic weighted average shares | 1087 | 1,079 | 1088 | 1,079 | ||||||||||||||||||||
outstanding | ||||||||||||||||||||||||
Diluted earnings per share - estimate | 2.09 | 1.91 | 9.4 | % | 4.03 | 3.70 | 8.9 | % | ||||||||||||||||
Diluted weighted average shares outstanding | 1,137 | 1,129 | 1,138 | 1,129 | ||||||||||||||||||||
Average for Quarter | Average for Six Months | |||||||||||||||
June 30 | % | June 30 | % | |||||||||||||
BALANCE SHEET SUMMARY | 2025 | 2024 | Change | 2025 | 2024 | Change | ||||||||||
Total loans | $ | 317,410 | $ | 306,551 | 3.5 | % | $ | 309,931 | $ | 304,424 | 1.8 | % | ||||
Total short term investments | 66,510 | 25,626 | 159.5 | % | 60,265 | 31,637 | 90.5 | % | ||||||||
FRB Stock | 459 | 435 | 5.5 | % | 454 | 434 | 4.6 | % | ||||||||
Total investment securities | 133,949 | 137,088 | -2.3 | % | 135,125 | 139,855 | -3.4 | % | ||||||||
Earning assets | 518,327 | 469,700 | 10.4 | % | 505,775 | 476,350 | 6.2 | % | ||||||||
Total assets | 530,621 | 477,700 | 11.1 | % | 517,069 | 483,981 | 6.8 | % | ||||||||
Noninterest bearing deposits | 137,911 | 131,609 | 4.8 | % | 135,966 | 129,688 | 4.8 | % | ||||||||
Interest bearing deposits | 332,645 | 293,548 | 13.3 | % | 321,429 | 301,289 | 6.7 | % | ||||||||
Total deposits | 470,556 | 425,157 | 10.7 | % | 457,395 | 430,977 | 6.1 | % | ||||||||
Fed Funds Purchased and Repurchase Agreements | 0 | 0 | N/M | 0 | 0 | N/M | ||||||||||
Shareholders' equity | $ | 62,680 | $ | 54,951 | 14.1 | % | $ | 61,767 | $ | 54,437 | 13.5 | % | ||||
TRINITY BANK N.A. | ||||||||||||||||||||
(Unaudited) | ||||||||||||||||||||
(Dollars in thousands, except per share data) | ||||||||||||||||||||
Average for Quarter Ending | ||||||||||||||||||||
June 30, | March 31, | Dec 31, | Sep 30, | June 30, | ||||||||||||||||
BALANCE SHEET SUMMARY | 2025 | 2025 | 2024 | 2024 | 2024 | |||||||||||||||
Total loans | $ | 317,410 | $ | 302,369 | $ | 297,595 | $ | 300,487 | $ | 306,551 | ||||||||||
Total short term investments | 66,510 | 53,950 | 84,667 | 38,112 | 25,626 | |||||||||||||||
FRB Stock | 459 | 449 | 438 | 437 | 435 | |||||||||||||||
Total investment securities | 133,949 | 136,314 | 139,200 | 137,751 | 137,088 | |||||||||||||||
Earning assets | 518,327 | 493,082 | 521,900 | 476,787 | 469,700 | |||||||||||||||
Total assets | 530,621 | 503,366 | 529,766 | 485,034 | 477,700 | |||||||||||||||
Noninterest bearing deposits | 137,911 | 133,982 | 140,237 | 131,659 | 131,609 | |||||||||||||||
Interest bearing deposits | 332,645 | 310,105 | 331,293 | 297,480 | 293,548 | |||||||||||||||
Total deposits | 470,556 | 444,087 | 471,529 | 429,139 | 425,157 | |||||||||||||||
Fed Funds Purchased and Repurchase Agreements | 0 | 0 | 0 | 0 | 0 | |||||||||||||||
Shareholders' equity | $ | 62,680 | $ | 60,843 | $ | 58,388 | $ | 56,857 | $ | 54,951 | ||||||||||
Quarter Ended | ||||||||||||||||||
June 30, | March 31, | Dec 31, | Sep 30, | June 30, | ||||||||||||||
HISTORICAL EARNINGS SUMMARY | 2025 | 2025 | 2024 | 2024 | 2024 | |||||||||||||
Interest income | $ | 7,455 | $ | 6,975 | $ | 7,426 | $ | 7,112 | $ | 7,107 | ||||||||
Interest expense | 2,295 | 2,149 | 2,681 | 2,749 | 2,713 | |||||||||||||
Net Interest Income | 5,160 | 4,826 | 4,745 | 4,363 | 4,394 | |||||||||||||
Service charges on deposits | 76 | 71 | 70 | 65 | 64 | |||||||||||||
Other income | 131 | 106 | 112 | 109 | 121 | |||||||||||||
Total Non Interest Income | 207 | 177 | 182 | 174 | 185 | |||||||||||||
Salaries and benefits expense | 1,731 | 1,508 | 1,343 | 1,368 | 1,319 | |||||||||||||
Occupancy and equipment expense | 140 | 123 | 117 | 133 | 122 | |||||||||||||
Other expense | 712 | 814 | 575 | 601 | 657 | |||||||||||||
Total Non Interest Expense | 2,583 | 2,445 | 2,035 | 2,102 | 2,098 | |||||||||||||
Pretax pre-provision income | 2,784 | 2,558 | 2,892 | 2,435 | 2,481 | |||||||||||||
Gain on sale of securities | 0 | 6 | 1 | 4 | (4 | ) | ||||||||||||
Gain on sale of Other Assets | 0 | 0 | 0 | 0 | 36 | |||||||||||||
Provision for Loan Losses | 0 | 0 | 350 | 0 | 0 | |||||||||||||
Earnings before income taxes | 2,784 | 2,564 | 2,543 | 2,439 | 2,514 | |||||||||||||
Provision for income taxes | 410 | 355 | 365 | 340 | 360 | |||||||||||||
Net Earnings | $ | 2,374 | $ | 2,209 | $ | 2,178 | $ | 2,099 | $ | 2,154 | ||||||||
Diluted earnings per share | $ | 2.09 | $ | 1.94 | $ | 1.92 | $ | 1.86 | $ | 1.91 | ||||||||
TRINITY BANK N.A. | ||||||||||||||||||||
(Unaudited) | ||||||||||||||||||||
(Dollars in thousands, except per share data) | ||||||||||||||||||||
Ending Balance | ||||||||||||||||||||
June 30, | March 31, | Dec. 31, | Sept. 30, | June 30, | ||||||||||||||||
HISTORICAL BALANCE SHEET | 2025 | 2025 | 2024 | 2024 | 2024 | |||||||||||||||
Total loans | $ | 325,809 | $ | 304,944 | $ | 305,864 | $ | 296,906 | $ | 304,810 | ||||||||||
FRB Stock | 461 | 456 | 439 | 438 | 435 | |||||||||||||||
Total short term investments | 55,130 | 90,040 | 69,746 | 59,576 | 10,003 | |||||||||||||||
Total investment securities | 132,989 | 124,619 | 138,306 | 137,510 | 136,331 | |||||||||||||||
Total earning assets | 514,389 | 520,059 | 514,355 | 494,430 | 451,579 | |||||||||||||||
Allowance for loan losses | (5,589 | ) | (5,586 | ) | (5,583 | ) | (5,230 | ) | (5,227 | ) | ||||||||||
Premises and equipment | 4,079 | 4,044 | 4,123 | 2,393 | 2,397 | |||||||||||||||
Other Assets | 14,296 | 10,297 | 9,339 | 9,739 | 14,276 | |||||||||||||||
Total assets | 527,175 | 528,814 | 522,234 | 501,332 | 463,025 | |||||||||||||||
Noninterest bearing deposits | 133,902 | 140,500 | 146,834 | 137,594 | 128,318 | |||||||||||||||
Interest bearing deposits | 331,050 | 329,329 | 318,206 | 305,010 | 280,945 | |||||||||||||||
Total deposits | 464,952 | 469,829 | 465,040 | 442,604 | 409,263 | |||||||||||||||
Fed Funds Purchased and Repurchase Agreements | 0 | 0 | 0 | 0 | 0 | |||||||||||||||
Other Liabilities | 3,072 | 2,661 | 2,711 | 2,901 | 2,804 | |||||||||||||||
Total liabilities | 468,024 | 472,490 | 467,751 | 445,505 | 412,067 | |||||||||||||||
Shareholders' Equity Actual | 63,664 | 62,276 | 59,758 | 57,976 | 55,915 | |||||||||||||||
Unrealized Gain/Loss - AFS | (4,513 | ) | (5,952 | ) | (5,275 | ) | (2,149 | ) | (4,957 | ) | ||||||||||
Total Equity | $ | 59,151 | $ | 56,324 | $ | 54,483 | $ | 55,827 | $ | 50,958 | ||||||||||
Quarter Ending | |||||||||||||||||
June 30, | March 31, | Dec. 31, | Sept. 30, | June 30, | |||||||||||||
NONPERFORMING ASSETS | 2025 | 2025 | 2024 | 2024 | 2024 | ||||||||||||
Nonaccrual loans | $ | 424 | $ | 949 | $ | 1,047 | $ | 0 | $ | 0 | |||||||
Restructured loans | 0 | 0 | 0 | 505 | 552 | ||||||||||||
Other real estate & foreclosed assets | 0 | 0 | 0 | 0 | 0 | ||||||||||||
Accruing loans past due 90 days or more | 0 | 0 | 0 | 0 | 0 | ||||||||||||
Total nonperforming assets | $ | 424 | $ | 949 | $ | 1,047 | $ | 505 | $ | 552 | |||||||
Accruing loans past due 30-89 days | $ | 0 | $ | 1,000 | $ | 0 | $ | 39 | $ | 1,274 | |||||||
Total nonperforming assets as a percentage | |||||||||||||||||
of loans and foreclosed assets | 0.13 | % | 0.31 | % | 0.34 | % | 0.17 | % | 0.18 | % | |||||||
TRINITY BANK N.A. | ||||||||||||||||||||
(Unaudited) | ||||||||||||||||||||
(Dollars in thousands, except per share data) | ||||||||||||||||||||
Quarter Ending | ||||||||||||||||||||
ALLOWANCE FOR | June 30, | March 31, | Dec. 31, | Sept. 30, | June 30, | |||||||||||||||
LOAN LOSSES | 2025 | 2025 | 2024 | 2024 | 2024 | |||||||||||||||
Balance at beginning of period | $ | 5,586 | $ | 5,583 | $ | 5,230 | $ | 5,227 | $ | 5,224 | ||||||||||
Loans charged off | 0 | 0 | 0 | 0 | 0 | |||||||||||||||
Loan recoveries | 3 | 3 | 3 | 3 | 3 | |||||||||||||||
Net (charge-offs) recoveries | 3 | 3 | 3 | 3 | 3 | |||||||||||||||
Provision for loan losses | 0 | 0 | 350 | 0 | 0 | |||||||||||||||
Balance at end of period | $ | 5,589 | $ | 5,586 | $ | 5,583 | $ | 5,230 | $ | 5,227 | ||||||||||
Allowance for loan losses | ||||||||||||||||||||
as a percentage of total loans | 1.72 | % | 1.83 | % | 1.83 | % | 1.76 | % | 1.71 | % | ||||||||||
Allowance for loan losses | ||||||||||||||||||||
as a percentage of nonperforming assets | 1318 | % | 589 | % | 533 | % | 1036 | % | 947 | % | ||||||||||
Net charge-offs (recoveries) as a | ||||||||||||||||||||
percentage of average loans | 0.00 | % | 0.00 | % | 0.00 | % | 0.00 | % | 0.00 | % | ||||||||||
Provision for loan losses | ||||||||||||||||||||
as a percentage of average loans | 0.00 | % | 0.00 | % | 0.11 | % | 0.00 | % | 0.00 | % | ||||||||||
Quarter Ending | |||||||||||||||||
June 30, | March 31, | Dec. 31, | Sept. 30, | June 30, | |||||||||||||
SELECTED RATIOS | 2025 | 2025 | 2024 | 2024 | 2024 | ||||||||||||
Return on average assets (annualized) | 1.79 | % | 1.76 | % | 1.64 | % | 1.73 | % | 1.80 | % | |||||||
Return on average equity (annualized) | 16.69 | % | 15.67 | % | 15.85 | % | 15.91 | % | 17.42 | % | |||||||
Return on average equity (excluding unrealized gain on investments) | 15.15 | % | 14.52 | % | 14.92 | % | 14.77 | % | 15.68 | % | |||||||
Average shareholders' equity to average assets | 11.81 | % | 12.09 | % | 11.02 | % | 11.72 | % | 11.50 | % | |||||||
Yield on earning assets (tax equivalent) | 5.98 | % | 5.72 | % | 5.92 | % | 6.20 | % | 6.28 | % | |||||||
Effective Cost of Funds | 1.77 | % | 1.75 | % | 2.06 | % | 2.31 | % | 2.31 | % | |||||||
Net interest margin (tax equivalent) | 4.21 | % | 3.97 | % | 3.86 | % | 3.89 | % | 3.97 | % | |||||||
Efficiency ratio (tax equivalent) | 45.6 | % | 46.2 | % | 39.0 | % | 43.7 | % | 43.2 | % | |||||||
End of period book value per common share | $ | 54.42 | $ | 51.82 | $ | 50.21 | $ | 51.79 | $ | 47.23 | |||||||
End of period book value (excluding unrealized gain/loss on investments) | $ | 58.57 | $ | 57.29 | $ | 55.08 | $ | 53.78 | $ | 51.82 | |||||||
End of period common shares outstanding (in 000's) | 1,087 | 1,087 | 1,085 | 1,078 | 1,079 | ||||||||||||
TRINITY BANK N.A. | |||||||||||||||||||||||||||||||||
(Unaudited) | |||||||||||||||||||||||||||||||||
(Dollars in thousands, except per share data) | |||||||||||||||||||||||||||||||||
Three Months Ending | |||||||||||||||||||||||||||||||||
June 30, 2025 | June 30, 2024 | ||||||||||||||||||||||||||||||||
Tax | Tax | ||||||||||||||||||||||||||||||||
Average | Equivalent | Average | Equivalent | ||||||||||||||||||||||||||||||
YIELD ANALYSIS | Balance | Interest | Yield | Yield | Balance | Interest | Yield | Yield | |||||||||||||||||||||||||
Interest Earning Assets: | |||||||||||||||||||||||||||||||||
Short term investment | $ | 66,510 | $ | 740 | 4.45 | % | 4.45 | % | $ | 25,626 | $ | 356 | 5.56 | % | 5.56 | % | |||||||||||||||||
FRB Stock | 459 | 7 | 6.00 | % | 6.00 | % | 435 | 6 | 6.00 | % | 6.00 | % | |||||||||||||||||||||
Taxable securities | 4,944 | 52 | 4.21 | % | 4.21 | % | 495 | 6 | 4.85 | % | 4.85 | % | |||||||||||||||||||||
Tax Free securities | 129,005 | 1,111 | 3.44 | % | 4.36 | % | 136,593 | 1,234 | 3.61 | % | 4.41 | % | |||||||||||||||||||||
Loans | 317,409 | 5,545 | 6.99 | % | 6.99 | % | 306,551 | 5,504 | 7.18 | % | 7.18 | % | |||||||||||||||||||||
Total Interest Earning Assets | 518,327 | 7,455 | 5.75 | % | 5.98 | % | 469,700 | 7,106 | 6.05 | % | 6.28 | % | |||||||||||||||||||||
Noninterest Earning Assets: | |||||||||||||||||||||||||||||||||
Cash and due from banks | 6,199 | 5,791 | |||||||||||||||||||||||||||||||
Other assets | 11,683 | 7,436 | |||||||||||||||||||||||||||||||
Allowance for loan losses | (5,588 | ) | (5,227 | ) | |||||||||||||||||||||||||||||
Total Noninterest Earning Assets | 12,294 | 8,000 | |||||||||||||||||||||||||||||||
Total Assets | $ | 530,621 | $ | 477,700 | |||||||||||||||||||||||||||||
Interest Bearing Liabilities: | |||||||||||||||||||||||||||||||||
Transaction and Money Market accounts | $ | 216,131 | $ | 1,165 | 2.16 | % | 2.16 | % | 190,542 | $ | 1,522 | 3.20 | % | 3.20 | % | ||||||||||||||||||
Certificates and other time deposits | 116,430 | 1,130 | 3.88 | % | 3.88 | % | 103,006 | 1,191 | 4.62 | % | 4.62 | % | |||||||||||||||||||||
Other borrowings | 0 | 0 | 0.00 | % | 0.00 | % | 0 | 0 | 0.00 | % | 0.00 | % | |||||||||||||||||||||
Total Interest Bearing Liabilities | 332,561 | 2,295 | 2.76 | % | 2.76 | % | 293,548 | 2,713 | 3.70 | % | 3.70 | % | |||||||||||||||||||||
Noninterest Bearing Liabilities: | |||||||||||||||||||||||||||||||||
Demand deposits | 137,995 | 131,609 | |||||||||||||||||||||||||||||||
Other liabilities | 3,154 | 3,069 | |||||||||||||||||||||||||||||||
Shareholders' Equity | 56,911 | 49,474 | |||||||||||||||||||||||||||||||
Total Liabilities and Shareholders Equity | $ | 530,621 | $ | 477,700 | |||||||||||||||||||||||||||||
Net Interest Income and Spread | $ | 185,766 | $ | 5,160 | 2.99 | % | 3.22 | % | 176,152 | $ | 4,393 | 2.35 | % | 2.59 | % | ||||||||||||||||||
Net Interest Margin | 3.98 | % | 4.21 | % | 3.74 | % | 3.97 | % | |||||||||||||||||||||||||
TRINITY BANK N.A. | ||||||||||||||||
(Unaudited) | ||||||||||||||||
(Dollars in thousands, except per share data) | ||||||||||||||||
June 30 | June 30 | |||||||||||||||
2025 | % | 2024 | % | |||||||||||||
LOAN PORTFOLIO | ||||||||||||||||
Commercial and industrial | $ | 164,845 | 50.60 | % | $ | 164,397 | 53.93 | % | ||||||||
Real estate: | ||||||||||||||||
Commercial | 109,089 | 33.48 | % | 96,074 | 31.52 | % | ||||||||||
Residential | 13,100 | 4.02 | % | 16,263 | 5.34 | % | ||||||||||
Construction and development | 38,427 | 11.79 | % | 27,722 | 9.09 | % | ||||||||||
Consumer | 348 | 0.11 | % | 354 | 0.12 | % | ||||||||||
Total loans | $ | 325,809 | 100.00 | % | 304,810 | 100.00 | % | |||||||||
June 30 | June 30 | |||
2025 | 2024 | |||
REGULATORY CAPITAL DATA | ||||
Tier 1 Capital | $ | 63,663 | $ | 55,914 |
Total Capital (Tier 1 + Tier 2) | $ | 66,622 | $ | 60,247 |
Total Risk-Adjusted Assets | $ | 346,179 | $ | 345,039 |
Tier 1 Risk-Based Capital Ratio | 17.99 | % | 16.21 | % |
Total Risk-Based Capital Ratio | 19.25 | % | 17.46 | % |
Tier 1 Leverage Ratio | 12.37 | % | 11.70 | % |
OTHER DATA | ||||
Full Time Equivalent | ||||
Employees (FTE's) | 31 | 29 | ||
Stock Price Range | ||||
(For the Three Months Ended): | ||||
High | $ | 87.50 | $ | 94.00 |
Low | $ | 86.50 | $ | 86.75 |
Close | $ | 87.00 | $ | 89.75 |
SOURCE: Trinity Bank, NA (Fort Worth, Texas)
View the original press release on ACCESS Newswire
T.Ward--AMWN