
Altigen Technologies Reports Full Year and Fourth Quarter Fiscal 2024 Results
 Turkey eyes F110 fighter jet engines as Trump comes to town

 England, Mexico take centre stage in Azteca blockbuster

 'Very dangerous' super typhoon nears US Pacific islands

 Australia stand by under-fire Popovic after World Cup exit

 Afghan car trade screeches to a halt due to regional wars

 Pipe dreams: Bangladesh surfers chase waves at Asian Games

 England can write new Azteca history by meeting Mexico challenge, says Tuchel

 Paraguay coach says team 'fought like lions' in World Cup loss to France

 Violent crime wave beleaguers Israel's Arab youth

 Severe weather disrupts Trump's America 250 celebration

 Judge, Trout among MLB All-Star Game starter selections

 Davis-Woodhall opens up about depression after Eugene win

 France battle past Paraguay to set up Morocco World Cup showdown

 Jefferson-Wooden holds off Richardson for Eugene 100m win

 Stopping Haaland no mystery for Brazil, says Ancelotti

 Coach says Morocco 'no longer a surprise' after reaching World Cup quarters

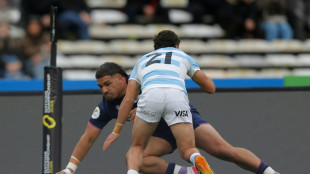 Tuipulotu guides Scotland past Argentina with record score

 'Proud' Marsch says Canada better side in World Cup exit

 Norway must handle occasion against Brazil, says Solbakken

 Bethell upstages 'unbelievable' Sooryavanshi as England beat India

 'No point in racing' says frustrated Verstappen after British GP qualifying

 Tour de France yellow gives Vingegaard crash closure

 Smiling Antonelli proves all-round quality with pole at British GP

 Vingegaard takes Tour de France lead with 'perfect start'

 Osaka eyes Sabalenka revenge in Wimbledon last 16

4th Quarter Revenues Hit a 12 Year High
Altigen Technologies (OTCQB:ATGN), a leading Silicon Valley-based Microsoft Cloud Communications Solutions provider, announced today its financial results for the fourth quarter and year ended September 30, 2024.
"This quarter demonstrates the effectiveness of Altigen's transformation initiatives," said Jeremiah Fleming, Altigen President & CEO. "We've streamlined operations, achieved consistent performance improvements, and are making tangible progress in bringing our AI solutions to market, paving the way for sustainable growth."
Full Year Highlights (Fiscal 2024 versus Fiscal 2023)
Net revenue was $13.6 million, compared with $13.7 million;
Services revenue was $5.1 million, compared with $4.3 million;
Cloud services revenue was $7.1 million, compared with $7.6 million;
Gross margin decreased to 61.6%, compared with 63.2% in the previous year;
GAAP net income totaled $1.6 million, with diluted EPS of $0.06, primarily due to a $1.8 million non-cash tax-related benefit resulting from the release of the valuation allowance for deferred tax assets;
Non-GAAP1 net income and non-GAAP diluted EPS of $0.5 million and $0.02, respectively.
Fourth Quarter Highlights (Fiscal 2024 versus Fiscal 2023)
Net Revenue was $3.7 million, compared with $3.5 million;
Services revenue was $1.7 million, compared with $1.1 million;
Cloud services revenue was $1.7 million, compared with $2.0 million;
Gross margin increased to 63.9%, compared with 62.4% in the prior year;
GAAP net income was $2.1 million, with diluted EPS of $0.08, driven primarily by the previously mentioned non-cash, tax-related benefit of $1.8 million;
Non-GAAP1 net income and non-GAAP diluted EPS of $0.5 million and $0.02, respectively.
Select Financial Metrics: Fiscal 2024 versus Fiscal 2023 | |||||||||||||||||||||
(in thousands, except for EPS and percentages) | Fiscal | Fiscal | Change | YTD | YTD | Change | |||||||||||||||
Total Revenue | $ | 3,736 | $ | 3,482 | 7.3 | % | $ | 13,619 | $ | 13,681 | -0.5 | % | |||||||||
Cloud Services | 1,680 | 1,983 | -15.3 | % | 7,097 | 7,656 | -7.3 | % | |||||||||||||
Services and Other | 1,731 | 1,100 | 57.4 | % | 5,159 | 4,301 | 19.9 | % | |||||||||||||
Legacy Products | 325 | 399 | -18.5 | % | 1,363 | 1,724 | -20.9 | % | |||||||||||||
Software Assurance | 315 | 353 | -10.8 | % | 1,293 | 1,551 | -16.6 | % | |||||||||||||
Perpetual Software License | 10 | 46 | -78.3 | % | 70 | 173 | -59.5 | % | |||||||||||||
GAAP Operating Income/(Loss) | $ | 209 | $ | 30 | 596.7 | % | $ | (305 | ) | $ | (436 | ) | nm | ||||||||
Operating Margin | 5.6 | % | 0.9 | % | -2.2 | % | -3.2 | % | |||||||||||||
Non-GAAP Operating Income/(Loss) | $ | 228 | $ | 58 | 293.1 | % | $ | (245 | ) | $ | (317 | ) | nm | ||||||||
Non-GAAP Operating Margin | 6.1 | % | 1.7 | % | -1.8 | % | -2.3 | % | |||||||||||||
GAAP Net Income/(Loss) | $ | 2,079 | $ | (2,813 | ) | nm | $ | 1,560 | $ | (3,323 | ) | nm | |||||||||
GAAP Income/(Loss) Per Share | $ | 0.08 | $ | (0.11 | ) | nm | $ | 0.06 | $ | (0.14 | ) | nm | |||||||||
Non-GAAP Net Income | $ | 493 | $ | 145 | 240.0 | % | $ | 467 | $ | 324 | 44.1 | % | |||||||||
Non-GAAP Diluted Earnings Per Share | $ | 0.02 | $ | 0.01 | nm | $ | 0.02 | $ | 0.01 | nm | |||||||||||
Adjusted EBITDA(1) | $ | 507 | $ | 109 | 365.1 | % | $ | 495 | $ | 252 | 96.4 | % | |||||||||
Cash Flow from Operations | $ | 641 | $ | (236 | ) | nm | $ | 510 | $ | 62 | nm | ||||||||||
nm = not measurable/meaningful; *may not add up due to rounding
Throughout this release, the use of non-GAAP financial measures is intended to provide useful information that supplements Altigen's results in accordance with GAAP. Please refer to the Reconciliation of Non-GAAP Financial Measure at the end of this release.
Trended Financial Information | |||||||||||||||||||||||||||||||||||||||
(in thousands, except for EPS and percentages) | Fiscal | Fiscal | Fiscal | Fiscal | Fiscal | Fiscal | Fiscal | Fiscal | FY2023 | FY2024 | |||||||||||||||||||||||||||||
Total Revenue | $ | 3,460 | $ | 3,373 | $ | 3,366 | $ | 3,482 | $ | 3,240 | $ | 3,360 | $ | 3,283 | $ | 3,736 | $ | 13,681 | $ | 13,619 | |||||||||||||||||||
Cloud Services | 1,822 | 1,894 | 1,957 | 1,983 | 1,890 | 1,817 | 1,710 | 1,680 | 7,656 | 7,097 | |||||||||||||||||||||||||||||
Services and Other | 1,174 | 1,028 | 999 | 1,100 | 996 | 1,183 | 1,249 | 1,731 | 4,301 | 5,159 | |||||||||||||||||||||||||||||
Legacy Products | 464 | 451 | 410 | 399 | 354 | 360 | 324 | 325 | 1,724 | 1,363 | |||||||||||||||||||||||||||||
Software Assurance | 424 | 390 | 384 | 353 | 342 | 340 | 296 | 315 | 1,551 | 1,293 | |||||||||||||||||||||||||||||
Perpetual Software License | 40 | 61 | 26 | 46 | 12 | 20 | 28 | 10 | 173 | 70 | |||||||||||||||||||||||||||||
GAAP Operating Income/(Loss) | $ | (188 | ) | $ | (131 | ) | $ | (147 | ) | $ | 30 | $ | (342 | ) | $ | (240 | ) | $ | 68 | $ | 209 | $ | (436 | ) | $ | (305 | ) | ||||||||||||
Operating Margin | -5.4 | % | -3.9 | % | -4.4 | % | 0.9 | % | -10.6 | % | -7.1 | % | 2.1 | % | 5.6 | % | -3.2 | % | -2.2 | % | |||||||||||||||||||
Non-GAAP Operating Income/(Loss) | $ | (156 | ) | $ | (101 | ) | $ | (118 | ) | $ | 58 | $ | (330 | ) | $ | (225 | ) | $ | 82 | $ | 228 | $ | (317 | ) | $ | (245 | ) | ||||||||||||
Non-GAAP Operating Margin | -4.5 | % | -3.0 | % | -3.5 | % | 1.7 | % | -10.2 | % | -6.7 | % | 2.5 | % | 6.1 | % | -2.3 | % | -1.8 | % | |||||||||||||||||||
GAAP Net Income/(Loss) | $ | (188 | ) | $ | (140 | ) | $ | (183 | ) | $ | (2,813 | ) | $ | (345 | ) | $ | (236 | ) | $ | 62 | $ | 2,079 | $ | (3,324 | ) | $ | 1,560 | ||||||||||||
Non-GAAP Net Income/(Loss) | $ | 44 | $ | 95 | $ | 40 | $ | 145 | $ | (156 | ) | $ | (72 | ) | $ | 202 | $ | 493 | $ | 324 | $ | 467 | |||||||||||||||||
Non-GAAP Diluted Earnings/ Loss Per Share | $ | 0.00 | $ | 0.00 | $ | 0.00 | $ | 0.01 | $ | (0.01 | ) | $ | (0.00 | ) | $ | 0.01 | $ | 0.02 | $ | 0.01 | $ | 0.02 | |||||||||||||||||
Adjusted EBITDA(1) | $ | 44 | $ | 95 | $ | 4 | $ | 109 | $ | (159 | ) | $ | (67 | ) | $ | 214 | $ | 507 | $ | 252 | $ | 495 | |||||||||||||||||
Throughout this release, the use of non-GAAP financial measures is intended to provide useful information that supplements Altigen's results in accordance with GAAP. Please refer to the Reconciliation of Non-GAAP Financial Measure at the end of this release.
Conference Call
Altigen will be discussing its financial results and outlook on a conference call today at 2:00 p.m. Pacific Time (5:00 p.m. ET). The conference call can be accessed by dialing (888) 506-0062 (domestic) or (973) 528-0011 (international), conference ID #182309. A live webcast will also be made available at www.altigen.com. To access the replay, dial (877) 481-4010 (domestic) or (919) 882-2331 (international), conference ID #51729. A web archive will be made available at www.altigen.com for 90 days following the call's conclusion.
About Altigen Technologies
Altigen Technologies (OTCQB: ATGN) is focused on driving digital transformation in today's modern workplace. Our Cloud Communications solutions and Technology Consulting services empower companies of all sizes to elevate customer engagement, increase employee productivity and improve operational efficiency. We're headquartered in Silicon Valley with operations strategically located in five countries spanning three continents. For more information, call 1-888-ALTIGEN or visit our website at www.altigen.com.
Safe Harbor Statement
This press release contains forward‐looking information. The statements are based on reasonable assumptions, beliefs and expectations of management and the Company provides no assurance that actual events will meet management's expectations. Furthermore, the forward-looking statements contained in this press release are based on the Company's views of future events and financial performances which are subject to known and unknown risks and uncertainties including, but not limited to, statements regarding the Company's operational improvements, performance enhancements, AI solution development, and expectations for sustainable growth. There can be no assurances that the Company will achieve the expected results, and actual results may be materially different than expectations and from those stated or implied in forward-looking statements.
Please refer to the Company's most recent Annual Report filed with the OTCQB over-the-counter market for a further discussion of risks and uncertainties. Any forward-looking statement made by us in this press release is based only on information currently available to us and speaks only as of the date on which it is made. The Company does not undertake any obligation to update any forward-looking statements.
Contact:
Carolyn David
Vice President of Finance
Altigen Communications, Inc.
(408) 597-9033
www.altigen.com
ALTIGEN COMMUNICATIONS, INC. | ||||||||
September 30, 2024 | September 30, 2023 | |||||||
ASSETS | ||||||||
Current assets: | ||||||||
Cash and cash equivalents | $ | 2,575 | $ | 2,641 | ||||
Accounts receivable, net | 1,770 | 1,495 | ||||||
Other current assets | 185 | 236 | ||||||
Total current assets | 4,530 | 4,372 | ||||||
Property and equipment, net | - | 3 | ||||||
Operating lease right-of-use assets | 149 | 301 | ||||||
Goodwill | 2,725 | 2,725 | ||||||
Intangible assets, net | 1,242 | 1,568 | ||||||
Capitalized software development cost, net | 1,363 | 1,215 | ||||||
Deferred tax asset | 5,638 | 3,737 | ||||||
Other long-term assets | 2 | - | ||||||
Total assets | $ | 15,649 | $ | 13,921 | ||||
LIABILITIES AND STOCKHOLDERS' EQUITY | ||||||||
Current liabilities: | ||||||||
Accounts payable | $ | 98 | $ | 58 | ||||
Accrued compensation and benefits | 593 | 417 | ||||||
Accrued expenses | 446 | 455 | ||||||
Deferred consideration - current | 744 | 510 | ||||||
Operating lease liabilities - current | 104 | 324 | ||||||
Deferred revenue - current | 481 | 477 | ||||||
Total current liabilities | 2,466 | 2,241 | ||||||
Deferred consideration - long-term | - | 208 | ||||||
Operating lease liabilities - long-term | 49 | - | ||||||
Deferred revenue - long-term | 176 | 134 | ||||||
Total liabilities | 2,691 | 2,583 | ||||||
Stockholders' equity: | ||||||||
Common stock | 24 | 24 | ||||||
Treasury stock | (1,565 | ) | (1,565 | ) | ||||
Additional paid-in capital | 73,193 | 73,133 | ||||||
Accumulated deficit | (58,694 | ) | (60,254 | ) | ||||
Total stockholders' equity | 12,958 | 11,338 | ||||||
Total liabilities and stockholders' equity | $ | 15,649 | $ | 13,921 | ||||
ALTIGEN COMMUNICATIONS, INC. CONSOLIDATED STATEMENTS OF CASH FLOWS (Amounts in thousands) | |||||||
Twelve Months Ended September 30, | |||||||
2024 | 2023 | ||||||
Cash flows from operating activities: | |||||||
Net income (loss) | $ | 1,560 | $ | (3,324 | ) | ||
Adjustments to reconcile net income to net cash from operating activities: | |||||||
Impairment of capitalized software | 53 | - | |||||
Impairment of intangible assets | 142 | 131 | |||||
Depreciation and amortization | 3 | 4 | |||||
Deferred income tax expense | (1,901 | ) | 2,756 | ||||
Change in operating lease liabilities | (19 | ) | - | ||||
Amortization of intangible assets | 184 | 183 | |||||
Amortization of capitalized software | 375 | 587 | |||||
Stock-based compensation | 60 | 119 | |||||
Changes in operating assets and liabilities: | |||||||
Accounts receivable and unbilled accounts receivable | (275 | ) | (275 | ) | |||
Prepaid expenses and other current assets | 51 | (30 | ) | ||||
Other long-term assets | (2 | ) | 37 | ||||
Accounts payable | 40 | 5 | |||||
Accrued expenses | 193 | 30 | |||||
Deferred revenue | 46 | (161 | ) | ||||
Net cash provided by operating activities | 510 | 62 | |||||
Cash flows from investing activities: | |||||||
Capitalized software development costs | (576 | ) | (471 | ) | |||
Net cash used in investing activities | (576 | ) | (471 | ) | |||
Cash flows from financing activities: | |||||||
Payment related to business acquisition | - | (225 | ) | ||||
Proceeds from issuances of common stock | - | 43 | |||||
Net cash used in financing activities | - | (182 | ) | ||||
Net decrease in cash and cash equivalents | (66 | ) | (591 | ) | |||
Cash and cash equivalents, beginning of year | 2,641 | 3,232 | |||||
Cash and cash equivalents, end of year | $ | 2,575 | $ | 2,641 | |||
ALTIGEN COMMUNICATIONS, INC. | ||||||||||||||||
Three Months Ended | Twelve Months Ended | |||||||||||||||
September 30, | September 30, | |||||||||||||||
2024 | 2023 | 2024 | 2023 | |||||||||||||
Net revenue | $ | 3,736 | $ | 3,482 | $ | 13,619 | $ | 13,681 | ||||||||
Gross profit | 2,386 | 2,172 | 8,395 | 8,648 | ||||||||||||
Operating expenses: | ||||||||||||||||
Research and development | 885 | 1,187 | 4,268 | 5,066 | ||||||||||||
Selling, general & administrative | 1,292 | 955 | 4,432 | 4,018 | ||||||||||||
Operating income (loss) | 209 | 30 | (305 | ) | (436 | ) | ||||||||||
Interest expense | (3 | ) | (37 | ) | (26 | ) | (74 | ) | ||||||||
Interest and other income | 16 | 1 | 52 | 2 | ||||||||||||
Net income (loss) before provision for income taxes | 222 | (6 | ) | (279 | ) | (508 | ) | |||||||||
Income tax benefit (expense) (1) | 1,857 | (2,807 | ) | 1,839 | (2,816 | ) | ||||||||||
Net income (loss) | $ | 2,079 | $ | (2,813 | ) | $ | 1,560 | $ | (3,324 | ) | ||||||
Per share data: | ||||||||||||||||
Basic | $ | 0.08 | $ | (0.11 | ) | $ | 0.06 | $ | (0.14 | ) | ||||||
Diluted | $ | 0.08 | $ | (0.11 | ) | $ | 0.06 | $ | (0.14 | ) | ||||||
Weighted average shares outstanding: | ||||||||||||||||
Basic | 24,919 | 24,917 | 24,919 | 24,550 | ||||||||||||
Diluted | 25,903 | 24,917 | 25,959 | 24,550 | ||||||||||||
(1) The Company's fourth quarter fiscal year 2024 results include a non-cash tax benefit of $1.8 million, resulting from the release of the valuation allowance for deferred tax assets, while the Company's fourth quarter fiscal year 2023 results include a non-cash tax expense of approximately $2.7 million, primarily due to differences between the Company's income tax rate and the statutory rate.
ALTIGEN COMMUNICATIONS, INC. | |||||||||
Three Months Ended | Twelve Months Ended | ||||||||
September 30, | September 30, | ||||||||
2024 | 2023 | 2024 | 2023 | ||||||
Reconciliation of GAAP to Non-GAAP Gross Profit: | |||||||||
GAAP gross profit | $ | 2,386 | $ | 2,172 | $ | 8,395 | $ | 8,648 | |
Amortization of capitalized software | 56 | 124 | 335 | 531 | |||||
Amortization of acquired customer relationships | 40 | 40 | 160 | 160 | |||||
Non-GAAP gross profit | $ | 2,482 | $ | 2,336 | $ | 8,890 | $ | 9,339 | |
Reconciliation of GAAP to Non-GAAP Expenses: | |||||||||
GAAP operating expenses | $ | 2,177 | $ | 2,142 | $ | 8,700 | $ | 9,084 | |
Asset impairment | 142 | - | 142 | - | |||||
Depreciation and amortization | - | 1 | 3 | 4 | |||||
Amortization of capitalized software | 9 | 13 | 40 | 56 | |||||
Amortization of intangible assets | 6 | 6 | 24 | 24 | |||||
Stock-based compensation | 18 | 29 | 60 | 119 | |||||
Non-GAAP operating expenses | $ | 2,002 | $ | 2,093 | $ | 8,431 | $ | 8,881 | |
Reconciliation of GAAP to Non-GAAP Net Income: | |||||||||
GAAP net loss | $ | 2,079 | $ | (2,813) | $ | 1,560 | $ | (3,324) | |
Asset impairment | 142 | - | 142 | - | |||||
Depreciation and amortization | - | 1 | 3 | 4 | |||||
Amortization of capitalized software | 65 | 137 | 375 | 587 | |||||
Amortization of intangible assets | 46 | 46 | 184 | 184 | |||||
Stock-based compensation | 18 | 29 | 60 | 119 | |||||
Deferred tax asset valuation allowance | (1,857) | 2,745 | (1,857) | 2,754 | |||||
Non-GAAP net income | $ | 493 | $ | 145 | $ | 467 | $ | 324 | |
Per share data: | |||||||||
Basic | $ | 0.02 | $ | 0.01 | $ | 0.02 | $ | 0.01 | |
Diluted | $ | 0.02 | $ | 0.01 | $ | 0.02 | $ | 0.01 | |
Weighted average shares outstanding: | |||||||||
Basic | 24,919 | 24,917 | 24,919 | 24,550 | |||||
Diluted | 25,903 | 26,122 | 25,959 | 25,663 | |||||
Non-GAAP Financial Measures
In calculating non-GAAP financial measures, we exclude certain items to facilitate a review of the comparability of our core operating performance on a period-to-period basis. These non-GAAP financial measures exclude stock-based compensation expense, amortization of acquired intangible assets, depreciation and amortization expenses, acquisition-related costs, change in deferred tax asset valuation allowance, litigation costs and other non-recurring or unusual charges or benefits that may arise from time to time that we do not consider to be directly related to core operating performance. We use non-GAAP measures to evaluate the core operating performance of our business and to perform financial planning. Since we find these measures to be useful, we believe that investors benefit from seeing results reviewed by management in addition to seeing GAAP results. We believe that these non-GAAP measures, when read in conjunction with our GAAP financials, provide useful information to investors by facilitating: (i) the comparability of our on-going operating results over the periods presented and (ii) the ability to identify trends in our underlying business.
SOURCE: Altigen Technologies
O.M.Souza--AMWN