
Innodata Reports Fourth Quarter and Full Year 2025 Results
 Bittersweet World Cup for Gaza's football fans

 New heatwave disrupts trains, schools in France

 Starmer's Labour rival eyes win in UK poll key to PM's fate

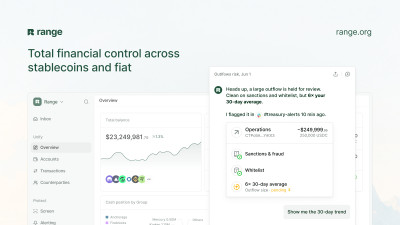 Range raises $8.3M Series A to unify treasury, risk and compliance across stablecoins and fiat

 Ibrahima Konate signs four-year deal with Real Madrid

 Innovations on show at Paris Vivatech fest

 Bird flu kills 13,000 seal pups on remote Australian island

 South Korean lawmakers launch probe into ballot paper shortages

 Taiwan president says hopes for $14 bn US arms sale 'as soon as possible'

 New wave of anti-LGBTQ laws sweeps Africa

 Jubilant New York on guard for Knicks parade

 New Zealander Manu has 'no fear' of Toulouse before Top 14 semi

 Pain-riddled South Korean man fights for right to die

 India learns to live with hotter summers

 EU wrestles over how to tackle China export flood

 Comedian Jordan Klepper wishes satire was harder in age of Trump

 Birthright citizenship helps spark US World Cup run

 Castro gives crucial backing to Cuba reforms

 U.S. Polo Assn. Unveils Spring-Summer 2027 Collection at the 110th Edition of Pitti Immagine Uomo

 Silver Storm Receives La Parrilla Surface Drilling Permits
 How to Become a Certified Botox Injector in Canada?

 Who Does the Best Fat Transfer to the Face in Florida?

 InterContinental Hotels Group PLC Announces Transaction in Own Shares - June 18

 Historic World Cup goal brings rare joy to DR Congo Ebola epicentre

 Kane double fires England World Cup bid as Ronaldo's Portugal stumble

48% Full-Year Revenue Growth and Strong Q4 Results
Anticipates ~35%+ Revenue Growth in 2026 with Expanding Customer Diversification
Announces Innovations in Dataset Creation and Evaluations for LLMs, AI Agents, and Physical AI (Robotics)
NEW YORK CITY, NY / ACCESS Newswire / February 26, 2026 / INNODATA INC. (Nasdaq:INOD) today reported results for the fourth quarter and the year ended December 31, 2025.
Revenue of $72.4 million for the three months ended December 31, 2025, representing 22% year-over-year organic revenue growth.
Revenue of $251.7 million for the year ended December 31, 2025, representing 48% year-over-year organic revenue growth.
Adjusted EBITDA of $15.7 million for the three months ended December 31, 2025, an increase of $1.6 million, or 11%, from $14.1 million in the same period last year.*
Adjusted EBITDA of $57.9 million for the year ended December 31, 2025, an increase of $23.3 million, or 68%, from $34.6 million in the same period last year.*
Net income of $8.8 million, or $0.28 per basic share and $0.25 per diluted share, for the three months ended December 31, 2025, compared to net income of $10.3 million, or $0.34 per basic share and $0.31 per diluted share, in the same period last year.
Net income of $32.2 million, or $1.01 per basic share and $0.92 per diluted share, for the year ended December 31, 2025, compared to net income of $28.7 million, or $0.98 per basic share and $0.89 per diluted share, in the same period last year.
Cash, cash equivalents and short-term investments were $82.2 million as of December 31, 2025 and $46.9 million as of December 31, 2024.
* Adjusted EBITDA is defined below.
Jack Abuhoff, CEO, said, "2025 was a defining year for Innodata. We delivered $72.4 million in fourth-quarter revenue and $251.7 million for the full year - representing 48% annual growth - while exceeding margin targets and analyst consensus across key metrics and investing aggressively in innovation to strengthen our platform, accelerate customer outcomes, and reinforce our leadership in the generative AI value chain.
"We believe we are entering 2026 with extraordinary momentum. Demand across frontier model training, agentic AI, and physical AI is accelerating, and we believe our role is evolving from data supplier to strategic lifecycle partner for some of the world's most advanced AI initiatives.
"Based on current forecasts, we anticipate approximately 35% or more revenue growth in 2026, with potential upside as programs scale," Abuhoff said.
In today's earnings conference call (dial-in information below), Abuhoff plans to discuss Innodata's program of data-centric innovation that is achieving:
Measurable improvements in model performance through data efficacy-driven LLM training methodologies;
Up to 25-point gains in AI agent constraint satisfaction under real-world complexity;
Durable resilience against adversarial attacks through scalable, high-fidelity, data-driven attack simulation systems;
Enhanced long-context reasoning performance through specialized structured dataset creation;
Large-scale, high-quality dataset engineering for physical AI and robotics, including egocentric and affordance-rich data;
A 6.45% improvement over prior state-of-the-art benchmarks in drone and small-object detection; and
The structural foundation for margin expansion through automation, synthetic data generation, and evaluation platforms.
Abuhoff concluded, "The future of AI will be shaped not only by larger models, but by the precision and rigor of the data ecosystems that make them reliable, adaptable, and production-ready. That is Innodata's domain. We are confident in our leadership and energized by the scale of the opportunity before us."
Amounts in this press release have been rounded. All percentages have been calculated using unrounded amounts.
Timing of Conference Call with Q&A
Innodata will conduct an earnings conference call, including a question-and-answer period, at 5:00 PM eastern time today. You can participate in this call by dialing the following call-in numbers:
The call-in numbers for the conference call are:
(+1) 800 549 8228 | North America |
(+44) 800 279 7040 | United Kingdom |
(+1) 289 819 1520 | International |
Participant Access Code | 27117# |
Replay dial-In
(+1) 888 660 6264 | North America |
(+1) 289 819 1325 | International |
Replay Passcode | 27117# |
It is recommended that participants dial in approximately 10 minutes prior to the start of the call. Investors are also invited to access a live Webcast of the conference call at the Investor Relations section of Innodata's website at https://investor.innodata.com/events-and-presentations/. Please note that the Webcast feature will be in listen-only mode.
Call-in replay will be available for seven days following the conference call, and Webcast replay will be available for 30 days following the conference call, at the Investor Relations section of Innodata's website at https://investor.innodata.com/events-and-presentations/.
About Innodata
Innodata (Nasdaq: INOD) is a global data engineering company. We believe that data and Artificial Intelligence (AI) are inextricably linked. Our mission is to enable the responsible advancement of artificial intelligence by providing the data, evaluation frameworks, and human expertise required to build AI systems that can be trusted at scale. We provide a range of transferable solutions, platforms, and services for Generative AI / AI builders and adopters. In every relationship, we honor our 36+ year legacy delivering the highest quality data and outstanding outcomes for our customers.
Visit www.innodata.com to learn more.
Forward-Looking Statements
This press release may contain certain forward-looking statements within the meaning of Section 21E of the Securities Exchange Act of 1934, as amended, and Section 27A of the Securities Act of 1933, as amended. These forward-looking statements include, without limitation, statements concerning our operations, economic performance, financial condition, developmental program expansion and position in the AI services market. Words such as "project," "forecast," "believe," "expect," "can," "continue," "could," "intend," "may," "should," "will," "anticipate," "indicate," "guide," "predict," "likely," "estimate," "plan," "potential," "possible," "promises," or the negatives thereof, and other similar expressions generally identify forward-looking statements.
These forward-looking statements are based on management's current expectations, assumptions and estimates and are subject to a number of risks and uncertainties, including, without limitation, impacts resulting from ongoing geopolitical conflicts; investments in large language models; that contracts may be terminated by customers; projected or committed volumes of work may not materialize; pipeline opportunities and customer discussions which may not materialize into work or expected volumes of work; the likelihood of continued development of the markets, particularly new and emerging markets, that our services support; the ability and willingness of our customers and prospective customers to execute business plans that give rise to requirements for our services; continuing reliance on project-based work in the Digital Data Solutions ("DDS") segment and the primarily at-will nature of such contracts and the ability of these customers to reduce, delay or cancel projects; potential inability to replace projects that are completed, canceled or reduced; our DDS segment's revenue concentration in a limited number of customers; our dependency on content providers in our Agility segment; our ability to achieve revenue and growth targets; difficulty in integrating and deriving synergies from acquisitions, joint ventures and strategic investments; potential undiscovered liabilities of companies and businesses that we may acquire; potential impairment of the carrying value of goodwill and other acquired intangible assets of companies and businesses that we acquire; a continued downturn in or depressed market conditions; changes in external market factors; the potential effects of U.S. global trade and monetary policy, including the interest rate policies of the Federal Reserve; changes in our business or growth strategy; the emergence of new, or growth in existing competitors; various other competitive and technological factors; our use of and reliance on information technology systems, including potential security breaches, cyber-attacks, privacy breaches or data breaches that result in the unauthorized disclosure of consumer, customer, employee or company information, or service interruptions; and other risks and uncertainties indicated from time to time in our filings with the Securities and Exchange Commission ("SEC").
Our actual results could differ materially from the results referred to in any forward-looking statements. Factors that could cause or contribute to such differences include, but are not limited to, the risks discussed in Part I, Item 1A. "Risk Factors," Part II, Item 7. "Management's Discussion and Analysis of Financial Condition and Results of Operations," and other parts of our Annual Report on Form 10-K, filed with the SEC on February 24, 2025, and in our other filings that we may make with the SEC. In light of these risks and uncertainties, there can be no assurance that the results referred to in any forward-looking statements will occur, and you should not place undue reliance on these forward-looking statements. These forward-looking statements speak only as of the date hereof.
We undertake no obligation to update or review any guidance or other forward-looking statements, whether as a result of new information, future developments or otherwise, except as may be required by the U.S. federal securities laws.
Company Contact
Aneesh Pendharkar
[email protected]
(201) 371-8000
Non-GAAP Financial Measures
In addition to the financial information prepared in conformity with U.S. GAAP ("GAAP"), we provide certain non-GAAP financial information. We believe that these non-GAAP financial measures assist investors in making comparisons of period-to-period operating results. In some respects, management believes non-GAAP financial measures are more indicative of our ongoing core operating performance than their GAAP equivalents by making adjustments that management believes are reflective of the ongoing performance of the business.
We believe that the presentation of this non-GAAP financial information provides investors a more complete understanding of our financial performance, competitive position, and prospects for the future, particularly by providing the same information that management and our Board of Directors use to evaluate our performance and manage the business. However, the non-GAAP financial measures presented in this press release have certain limitations in that they do not reflect all of the costs associated with the operations of our business as determined in accordance with GAAP. Therefore, investors should consider non-GAAP financial measures in addition to, and not as a substitute for, or as superior to, measures of financial performance prepared in accordance with GAAP. Further, the non-GAAP financial measures that we present may differ from similar non-GAAP financial measures used by other companies.
Adjusted Gross Profit and Adjusted Gross Margin
We define Adjusted Gross Profit as revenues less direct operating costs attributable to Innodata Inc. and its subsidiaries in accordance with GAAP, plus depreciation and amortization of intangible assets, stock-based compensation, non-recurring severance and other one-time costs included within direct operating cost.
We define Adjusted Gross Margin by dividing Adjusted Gross Profit over total GAAP revenues.
We use Adjusted Gross Profit and Adjusted Gross Margin to evaluate results of operations and trends between fiscal periods and believe that these measures are important components of our internal performance measurement process.
A reconciliation of Adjusted Gross Profit and Adjusted Gross Margin to the most directly comparable GAAP measure is included in the tables that accompany this release.
Adjusted EBITDA
We define Adjusted EBITDA as net income (loss) attributable to Innodata Inc. and its subsidiaries in accordance with GAAP before interest expense, income taxes, depreciation and amortization of intangible assets (which derives EBITDA), plus additional adjustments for loss on impairment of intangible assets and goodwill, stock-based compensation, income (loss) attributable to non-controlling interests, non-recurring severance, and other one-time costs.
We use Adjusted EBITDA to evaluate core results of operations and trends between fiscal periods and believe that these measures are important components of our internal performance measurement process.
A reconciliation of Adjusted EBITDA to the most directly comparable GAAP measure is included in the tables that accompany this release.
INNODATA INC. AND SUBSIDIARIES
CONDENSED CONSOLIDATED STATEMENTS OF OPERATIONS
(Unaudited)
(In thousands, except per-share amounts)
Three Months Ended | Year Ended | ||||||||||
December 31, | December 31, | ||||||||||
2025 | 2024 | 2025 | 2024 | ||||||||
Revenues | $ | 72,376 | $ | 59,180 | $ | 251,663 | $ | 170,461 | |||
Operating costs and expenses: | |||||||||||
Direct operating costs | 44,676 | 32,423 | 152,184 | 103,387 | |||||||
Selling and administrative expenses | 16,769 | 15,503 | 59,606 | 42,738 | |||||||
Interest income, net | (428 | ) | (94 | ) | (1,552 | ) | (149 | ) | |||
61,017 | 47,832 | 210,238 | 145,976 | ||||||||
Income before provision for income taxes | 11,359 | 11,348 | 41,425 | 24,485 | |||||||
Provision for income taxes | 2,526 | 1,045 | 9,244 | (4,190 | ) | ||||||
Consolidated net income | 8,833 | 10,303 | 32,181 | 28,675 | |||||||
Income attributable to non-controlling interests | - | 7 | - | 15 | |||||||
Net income attributable to Innodata Inc. and Subsidiaries | $ | 8,833 | $ | 10,296 | $ | 32,181 | $ | 28,660 | |||
Income per share attributable to Innodata Inc. and Subsidiaries: | |||||||||||
Basic | $ | 0.28 | $ | 0.34 | $ | 1.01 | $ | 0.98 | |||
Diluted | $ | 0.25 | $ | 0.31 | $ | 0.92 | $ | 0.89 | |||
Weighted average shares outstanding: | |||||||||||
Basic | 32,080 | 30,027 | 31,807 | 29,163 | |||||||
Diluted | 35,468 | 33,625 | 35,025 | 32,177 | |||||||
INNODATA INC. AND SUBSIDIARIES
CONDENSED CONSOLIDATED BALANCE SHEETS
(Unaudited)
(In thousands)
December 31, 2025 | December 31, 2024 | |||
ASSETS | ||||
Current assets: | ||||
Cash and cash equivalents | $ | 82,230 | $ | 46,897 |
Accounts receivable, net | 46,510 | 28,013 | ||
Prepaid expenses and other current assets | 6,654 | 6,090 | ||
Total current assets | 135,394 | 81,000 | ||
Property and equipment, net | 7,966 | 4,101 | ||
Right-of-use asset, net | 4,094 | 4,238 | ||
Other assets | 1,648 | 1,267 | ||
Deferred income taxes, net | 3,429 | 7,492 | ||
Intangibles, net | 13,983 | 13,353 | ||
Goodwill | 2,079 | 1,998 | ||
Total assets | $ | 168,593 | $ | 113,449 |
LIABILITIES AND STOCKHOLDERS' EQUITY | ||||
Current liabilities: | ||||
Accounts payable, accrued expenses and other | $ | 26,720 | $ | 17,455 |
Accrued salaries, wages and related benefits | 16,480 | 13,836 | ||
Income and other taxes | 4,471 | 5,695 | ||
Long-term obligations - current portion | 1,659 | 1,643 | ||
Operating lease liability - current portion | 1,202 | 877 | ||
Total current liabilities | 50,532 | 39,506 | ||
Deferred income taxes, net | 146 | 32 | ||
Long-term obligations, net of current portion | 7,625 | 6,744 | ||
Operating lease liability, net of current portion | 3,228 | 3,778 | ||
Total liabilities | 61,531 | 50,060 | ||
STOCKHOLDERS' EQUITY | 107,062 | 63,389 | ||
Total liabilities and stockholders' equity | $ | 168,593 | $ | 113,449 |
Year Ended | |||||
December 31, | |||||
2025 | 2024 | ||||
Cash flows from operating activities: | |||||
Consolidated net income | $ | 32,181 | $ | 28,675 | |
Adjustments to reconcile consolidated net income to net cash | |||||
provided by operating activities: | |||||
Depreciation and amortization | 6,889 | 5,796 | |||
Stock-based compensation | 11,144 | 3,998 | |||
Deferred income taxes | 4,101 | (5,609 | ) | ||
Provision for credit losses | 108 | 527 | |||
Pension cost | 1,343 | 1,237 | |||
Changes in operating assets and liabilities: | |||||
Accounts receivable | (18,350 | ) | (14,411 | ) | |
Prepaid expenses and other current assets | (480 | ) | (2,233 | ) | |
Other assets | (375 | ) | 1,177 | ||
Accounts payable, accrued expenses and other | 8,984 | 7,916 | |||
Accrued salaries, wages and related benefits | 2,619 | 6,063 | |||
Income and other taxes | (1,263 | ) | 1,879 | ||
Pension benefit payments | (149 | ) | (151 | ) | |
Net cash provided by operating activities | 46,752 | 34,864 | |||
Cash flows from investing activities: | |||||
Capital expenditures | (11,104 | ) | (7,741 | ) | |
Net cash used in investing activities | (11,104 | ) | (7,741 | ) | |
Cash flows from financing activities: | |||||
Proceeds from exercise of stock options | 3,331 | 6,668 | |||
Withholding taxes on net settlement of restricted stock units | (3,337 | ) | (97 | ) | |
Payment of long-term obligations | (420 | ) | (362 | ) | |
Net cash provided by (used in) financing activities | (426 | ) | 6,209 | ||
Effect of exchange rate changes on cash and cash equivalents | 111 | (255 | ) | ||
Net increase in cash and cash equivalents | 35,333 | 33,077 | |||
Cash and cash equivalents, beginning of year | 46,897 | 13,820 | |||
Cash and cash equivalents, end of year | $ | 82,230 | $ | 46,897 | |
INNODATA INC. AND SUBSIDIARIES
RECONCILIATION OF GAAP TO NON-GAAP FINANCIAL MEASURES
(Unaudited)
(In thousands)
Three Months Ended December 31, | Year Ended December 31, | ||||||||||
Consolidated | 2025 | 2024 | 2025 | 2024 | |||||||
Gross Profit attributable to Innodata Inc. and Subsidiaries | $ | 27,700 | $ | 26,757 | $ | 99,479 | $ | 67,074 | |||
Depreciation and amortization | 1,956 | 1,558 | 6,812 | 5,705 | |||||||
Stock-based compensation | 429 | 81 | 1,741 | 281 | |||||||
Adjusted Gross Profit | $ | 30,085 | $ | 28,396 | $ | 108,032 | $ | 73,060 | |||
Gross Margin | 38 | % | 45 | % | 40 | % | 39 | % | |||
Adjusted Gross Margin | 42 | % | 48 | % | 43 | % | 43 | % | |||
Three Months Ended December 31, | Year Ended December 31, | ||||||||||
DDS Segment | 2025 | 2024 | 2025 | 2024 | |||||||
Gross Profit attributable to DDS Segment | $ | 24,124 | $ | 22,665 | $ | 85,404 | $ | 52,912 | |||
Depreciation and amortization | 985 | 692 | 3,210 | 2,133 | |||||||
Stock-based compensation | 420 | 76 | 1,699 | 252 | |||||||
Adjusted Gross Profit | $ | 25,529 | $ | 23,433 | $ | 90,313 | $ | 55,297 | |||
Gross Margin | 37 | % | 44 | % | 39 | % | 37 | % | |||
Adjusted Gross Margin | 39 | % | 46 | % | 41 | % | 39 | % | |||
Three Months Ended December 31, | Year Ended December 31, | ||||||||||
Synodex Segment | 2025 | 2024 | 2025 | 2024 | |||||||
Gross Profit attributable to Synodex Segment | $ | 209 | $ | 763 | $ | 1,325 | $ | 2,101 | |||
Depreciation and amortization | 165 | 97 | 455 | 503 | |||||||
Stock-based compensation | 1 | 1 | 1 | 2 | |||||||
Adjusted Gross Profit | $ | 375 | $ | 861 | $ | 1,781 | $ | 2,606 | |||
Gross Margin | 13 | % | 37 | % | 18 | % | 27 | % | |||
Adjusted Gross Margin | 24 | % | 42 | % | 24 | % | 33 | % | |||
Three Months Ended December 31, | Year Ended December 31, | ||||||||||
Agility Segment | 2025 | 2024 | 2025 | 2024 | |||||||
Gross Profit attributable to Agility Segment | $ | 3,367 | $ | 3,329 | $ | 12,750 | $ | 12,061 | |||
Depreciation and amortization | 806 | 769 | 3,147 | 3,069 | |||||||
Stock-based compensation | 8 | 4 | 41 | 27 | |||||||
Adjusted Gross Profit | $ | 4,181 | $ | 4,102 | $ | 15,938 | $ | 15,157 | |||
Gross Margin | 54 | % | 57 | % | 54 | % | 56 | % | |||
Adjusted Gross Margin | 67 | % | 70 | % | 68 | % | 71 | % | |||
INNODATA INC. AND SUBSIDIARIES
RECONCILIATION OF GAAP TO NON-GAAP FINANCIAL MEASURES
(Unaudited)
(In thousands)
Adjusted EBITDA
Three Months Ended December 31, | Year Ended December 31, | ||||||||||
Consolidated | 2025 | 2024 | 2025 | 2024 | |||||||
Net income attributable to Innodata Inc. and Subsidiaries | $ | 8,833 | $ | 10,296 | $ | 32,181 | $ | 28,660 | |||
Provision for income taxes | 2,526 | 1,045 | 9,244 | (4,190 | ) | ||||||
Interest (income) expense, net | (428 | ) | 97 | (1,552 | ) | 287 | |||||
Depreciation and amortization | 1,976 | 1,577 | 6,889 | 5,796 | |||||||
Stock-based compensation | 2,835 | 1,117 | 11,144 | 3,998 | |||||||
Non-controlling interests | - | 7 | - | 15 | |||||||
Adjusted EBITDA - Consolidated | $ | 15,742 | $ | 14,139 | $ | 57,906 | $ | 34,566 | |||
Three Months Ended December 31, | Year Ended December 31, | |||||||||||
DDS Segment | 2025 | 2024 | 2025 | 2024 | ||||||||
Net income attributable to DDS Segment | $ | 8,356 | $ | 8,954 | $ | 31,822 | $ | 25,446 | ||||
Provision for income taxes | 2,465 | 1,102 | 9,133 | (4,081 | ) | |||||||
Interest (income) expense, net | (429 | ) | 96 | (1,553 | ) | 283 | ||||||
Depreciation and amortization | 1,005 | 711 | 3,287 | 2,224 | ||||||||
Stock-based compensation | 2,678 | 1,373 | 10,370 | 3,896 | ||||||||
Non-controlling interests | - | 7 | - | 15 | ||||||||
Adjusted EBITDA - DDS Segment | $ | 14,075 | $ | 12,243 | $ | 53,059 | $ | 27,783 | ||||
Three Months Ended December 31, | Year Ended December 31, | ||||||||||
Synodex Segment | 2025 | 2024 | 2025 | 2024 | |||||||
Net income attributable to Synodex Segment | $ | 97 | $ | 935 | $ | 626 | $ | 1,908 | |||
Depreciation and amortization | 165 | 97 | 455 | 503 | |||||||
Stock-based compensation | 59 | (235 | ) | 254 | (99 | ) | |||||
Adjusted EBITDA - Synodex Segment | $ | 321 | $ | 797 | $ | 1,335 | $ | 2,312 | |||
Three Months Ended December 31, | Year Ended December 31, | |||||||||||
Agility Segment | 2025 | 2024 | 2025 | 2024 | ||||||||
Net income (loss) attributable to Agility Segment | $ | 380 | $ | 407 | $ | (267 | ) | $ | 1,306 | |||
Provision for income taxes | 61 | (57 | ) | 111 | (109 | ) | ||||||
Interest expense | 1 | 1 | 1 | 4 | ||||||||
Depreciation and amortization | 806 | 769 | 3,147 | 3,069 | ||||||||
Stock-based compensation | 98 | (21 | ) | 520 | 201 | |||||||
Adjusted EBITDA - Agility Segment | $ | 1,346 | $ | 1,099 | $ | 3,512 | $ | 4,471 | ||||
INNODATA INC. AND SUBSIDIARIES
CONSOLIDATED REVENUE BY SEGMENT
(Unaudited)
(In thousands)
Revenue by segment
Three Months Ended December 31, | Year Ended December 31, | ||||||||||
2025 | 2024 | 2025 | 2024 | ||||||||
Revenues: | |||||||||||
DDS | $ | 64,640 | $ | 51,289 | $ | 220,825 | $ | 141,098 | |||
Synodex | 1,590 | 2,070 | 7,322 | 7,864 | |||||||
Agility | 6,146 | 5,821 | 23,516 | 21,499 | |||||||
Total Consolidated | $ | 72,376 | $ | 59,180 | $ | 251,663 | $ | 170,461 | |||
SOURCE: Innodata Inc.
View the original press release on ACCESS Newswire
L.Durand--AMWN